
IMIB Journal of Innovation and Management

 Search
Matruprasad Mishra1 and Amar Kumar Mohanty2
1 KIIT School of Humanities, Patia, Bhubaneswar, Odisha, India
2 KIIT School of Law, Patia, Bhubaneswar, Odisha, India

Creative Commons Non Commercial CC BY-NC: This article is distributed under the terms of the Creative Commons Attribution-NonCommercial 4.0 License (http://www.creativecommons.org/licenses/by-nc/4.0/) which permits non-Commercial use, reproduction and distribution of the work without further permission provided the original work is attributed.
Consolidation of public sector banks (PSBs) is a part of reorganisation efforts with an aim to improve their profitability, solvency and efficiency. Of late merger of five subsidiaries of State Bank of India and Bharatiya Mahila Bank Ltd with it in April 2017 has kindled interest in restructuring of unprofitable banks by merging them with a profitable one. In August 2019, the Government of India announced amalgamation of 10 PSBs constituting them into four entities under Punjab National Bank, Canara Bank, Union Bank of India and Indian Bank. Earlier in April 2019, another merger had taken place following the integration of Dena Bank and Vijaya Bank with Bank of Baroda. Studies reveal that while in European countries bank mergers led to improved efficiency, in Asian countries like Indonesia recapitalisation and diversification of banks improved their profitability. In a study of Nigerian banks in Africa it is revealed that post-merger, employee morale diminishes due to stress and anxiety arising out of possible job loss and possible challenges to be met in the new environment. In the present study, the authors have tried to ascertain how profitability, solvency and efficiency of banks improved post-amalgamation in six PSBs. The outcome of the result is a mixed one, while some banks improved their profitability and solvency parameters, for others it is not so perceptible. However, efficiency indicators do not have any significant result for all six of them after amalgamation.
Return on assets, return on equity, earnings per share, capital adequacy ratio, net interest margin, operating cost, working fund, net profit
Introduction
Critics have questioned the continuance of public sector banks (PSBs) in India following slowdown in the economy and rising bad loans post-Global Financial Crisis during 2008–2009. Merger of PSBs or their privatisation was deemed to be a quick fix for arresting decline of banks and sustaining credit growth in the economy. In the wake of liberalisation in 1991, with PSBs controlling 90% of the market share, the Narasimham Committee recommended a three-tier banking structure with 3 or 4 large banks having international presence, about 8–10 national banks and several regional banks. After financial liberalisation in India in 1990s, there have been 32 bank mergers, involving private sector banks. There is only one instance of the merging of two nationalised banks in 1993, when New Bank of India merged with Punjab National Bank (PNB) following incurring net loss due to bad debt provisioning. Following merger, PNB sustained a net loss of Rs 96 crore in 1996, and took five years and more to get over the merger effect by a profit-making PSB. Thus, merger of PSBs is not an unmixed blessing (Krishnamurthy, 2017, pp. 12–15). While pre-Nationalisation of 14 major Private Sector Commercial Banks in 1969, small non-viable banks co-existed with other viable banks, the Government of India enacted necessary legislation in 1960 to empower Reserve Bank of India (RBI) for facilitating compulsory bank mergers and integrations of weak banks into stronger entities. During 1961, there were 30 compulsory mergers, while in 1964, 62 banks were integrated. Reorganisation of banks is done in India through merger and acquisition modalities (Devi, 2015, p. 52).
The merger of five Associate Banks (ABs) with State Bank of India (SBI) in April 2017 was a path-breaking act heralding large-scale bank mergers in subsequent years. The Government of India accorded sanction on 22 February and 20 March 2017 under SBI Act, 1955 to acquire five subsidiaries of SBI, namely State Bank of Bikaner and Jaipur, State Bank of Mysore, State Bank of Travancore, State Bank of Patiala, State Bank of Hyderabad and Bharatiya Mahila Bank Ltd. Out of five ABs, three were stock-listed with SBI owning larger equity holdings. The remaining two were wholly owned by SBI. The acquisition came into effect from 1 April 2017. As per ‘The Banker’ report dated July 2017, after the merger, SBI attained the rank of 54 among the top 1,000 global banks (State Bank of India, 2016–2017, p. 163). Post-merger the business mix of SBI would be ₹36.15 lakh crores1 with a market share of 22.09% in India.
The next merger of banks took place from 1 April 2019 following integration of Dena Bank and Vijaya Bank with Bank of Baroda (BOB). While both BOB and Vijaya Bank were strong banks, Dena Bank incurred losses. BOB had a large network of overseas branches, Vijaya Bank had a strong presence in South India and Dena Bank a large retail base. The combined business of BOB would become ₹14.82 lakh crores from earlier ₹10.30 lakh crore after the merger. It would be the largest commercial bank after SBI and ICICI Bank. After the merger, BOB with 9,475 branches, 13,544 ATMs and 85,657 employees would serve 12 crore customers (Bank of Baroda, 2018–2019, p. 42). The equity share transfer ratio was decided at 110:1,000 for every BOB share to that of Dena Bank. Similarly, the equity share transfer ratio was decided at 402:1,000 for every BOB share to that of Vijaya Bank.
On 30 August 2019, the finance minister Mrs Nirmala Sitharaman announced bank consolidation programme of PSBs, when 10 banks were amalgamated into 4 entities reducing total PSBs in India into 12 from earlier 27. Amalgamation of Punjab National Bank (PNB) with United Bank of India (UBI) and Oriental Bank of Commerce (OBC) was notified by the Government of India in the official Gazette on 4 March 2020. The merger process has been a part of Government’s larger vision of making the Indian banking sector relatively stronger and globally competitive. The amalgamation of three banks came into force with effect from 1 April 2020 (Punjab National Bank, 2019–2020, p. 189). The amalgamated PNB will have a wider geographical reach through 11,000 plus branches, more than 13,000 ATMs, 1 lakh employees and business mix of ₹18 lakh crores. The equity share transfer ratio was decided at 121:1000 for every PNB share to that of UBI. Further, the equity share transfer ratio was decided at 1150:1000 for every PNB share to that of OBC.
Post-amalgamation, Canara Bank would become the fourth largest PSB in the country with a total bank branch network of 10,324 and an asset base of USD 210 billion. The merger of Syndicate Bank with Canara Bank came into force w.e.f. 1 April 2020. The equity share transfer ratio was decided at 158:1000 for every Canara Bank share to that of Syndicate Bank. The merger protected the service conditions of all regular employees and officers of the merged bank as well as its pensioners. Post-merger, the business mix would be ₹10.57 lakh crores (Canara Bank, 2019–2020, p. 13).
The Government of India communicated on 30 August 2019 an alternative mechanism (AM) after consultation with the RBI regarding amalgamation of Allahabad Bank—a bank with 155 years legacy—with Indian Bank. Amalgamation of Allahabad Bank into Indian Bank made it the seventh largest PSB with ₹8 lakh crores business and 6,000 branch networks. The merger operation commenced from 1 April 2020 (Indian Bank, 2019–2020, p. 7). The equity share transfer ratio was decided at 115:1,000 for every Allahabad Bank share to that of Indian Bank.
Andhra Bank and Corporation Bank have been amalgamated into UBI w.e.f. 1 April 2020 vide gazette notification dated 4 March 2020. Post-merger, UBI would become a large bank with more than 9,500 branches, 13,300 plus ATMs, an employee strength of over 75,000 and over 120 million customers. The business mix post-amalgamated UBI would be ₹7.70 lakh crores (Union Bank of India, 2019–2020, p. 202). The equity share transfer ratio was decided at 325:1,000 for every UBI share to that of Andhra Bank. Similarly, the equity share transfer ratio was decided at 330:1,000 for every Corporation Bank share to that of UBI.
Review of Literature
Following Central Bank of Nigeria directive for improving operational inadequacies in risk management and inefficiency in credit and money market operations, ‘Merger and Acquisitions’ continued in the Nigeria in 2011. Greater market share, diversification of business, supply chain expansion, acquisition of talent and expertise, competitive advantage and resource re-allocation are some of the factors for which bank mergers are sought. However, merger and acquisitions led to attitudinal and productivity issues and employee turnover. Post-merger employee morale diminishes due to stress and anxiety arising out of possible job loss and possible challenges to be met in the new environment. However, the concept of productivity in a service industry like bank is quite different from that of manufacturing sector. Irrespective of measuring difficulties of productivity in service industries, studies have been made based on parameters like per employee deposit business, income, expenditure, net profit, spread and burden (Lukman, 2020, pp. 35–46).
Consolidation of banks are driven by a variety of objectives such as maximising shareholder value by increasing their efficiency, assuming economies of scale and additional market share is gained. Gains can occur through market diversification which may reduce cost and increase earnings on equity. Banks after merger can become what is called ‘too big to fall’ or Systemic Important Banks, when government can bail out banks in case of any distressed financial situation, thereby increasing shareholder value. However, merger may also occur due to promoters’ desire for empire building and improved compensation package to top executives out of higher institutional profits. Further, consolidation of banks can take place due to environmental factors such as policy deregulation, technological change, globalisation, or bankruptcy of the banking system. Financial distress or bankruptcy has been an important driving consideration for merger of weaker banks with a strong bank. This was the main reason of merger of banks during East Asian Crisis of 1997–1998 (Mohan, 2005, p. 1152).
In Europe and North America, costs as a proportion of gross income decrease as size increases, reach their lowest with an asset size of $20 to $50 billion and start rising after assets rise beyond $50 billion. However, their return on equity (ROE) rises if assets are more than $50 billion. On the other hand, in Japan banks with asset base of more than $50 billion have the lowest cost to income ratio. Thus, if efficiency using operating cost as yardstick is used, a ‘U’ shaped relationship is in evidence, but if ROE is a measure, no such relationship is visible. ROE is not influenced by operating costs but also by non-interest income. In a way, consolidation in banks can increase efficiency gains more due to diversification rather than increased size. This has happened in America and Australia, where cost efficiency did not improve following merger of banks. Efficiency benefits of merger should be weighed against adverse impact on competition and restrictive trade practices. Moreover, bank mergers need be market driven instead of government induced, so that one can measure pre- and post-merger effects in banks (Mohan, 2005, pp. 1155–1161).
In a study relating to bank mergers in Indonesia, it was noticed that recapitalisation and diversification of income are positively corelated to bank profitability, while size and overhead costs are inversely related to earnings from profits. Recapitalisation, foreclosures, mergers and acquisitions as well as privatisation of the state-controlled banks were undertaken post-East Asian Financial Crisis in 1997 in Indonesia. While high interest rate led to lower bank profitability, inflation had a positive effect on bank performances. Foreign banks report higher profit margins than domestic banks in developing countries while the reverse is true of developed countries. For any bank, return on assets (ROA) depend on bank’s internal policy measures and external factors like government’s fiscal policy and trade cycles in the economy. ROE on the other hand measures efficacy of management’s own policies to get the best return from shareholder’s fund through optimum utilisation (Habibullah, 2010, pp. 245–262).
During 1998 to 2004, rapid merger and acquisition of domestic and overseas banks in Europe took place. Improvement in costs, ROA and ROE of banks measured effectiveness of internal policies pursued in different countries of Europe. Domestic mergers were more numerous than cross-border activities in Europe. It was found that cross-border merged banks reported better results than domestic banks (Lozano-Vivas, n.d., p. 247). Resti (1998) used Data Envelopment Analysis analysing 67 bank mergers in Italy and concluded that merged banks improved efficiency in the post-merger period. It was seen, when banks of unequal size merge, their efficiency improved (Vander Vennet, 1996). Cuesta and Orea (2002) using ‘stochastic output distance function’ found that non-merged banks were better than merged ones on an average during 1985–1998 in Spanish savings banks. In a study of German cooperative banks between 1989 and 1997, found little evidence of efficiency gains among 283 bank mergers (Lozano-Vivas, n.d., pp. 248–249).
Competition, consolidation and restructuring the banks are major policy initiatives of RBI to ensure financial stability in the country. With a few exceptions, there is no significant post-merger improvement noticed in India. The author noticed three types of mergers such as horizontal, vertical and conglomerate under different market conditions. If two or more companies compete in the same market and geographic segment, it is called as horizontal. Vertical merger takes place at different stages of production and distribution between two companies. Firms engaged in unrelated lines of business activities resort to conglomerate mergers. Profile, logic, evaluation methodology and integration of merging entities depend on type of merger (Devi, 2015, pp. 50–51).
Non-performing assets (NPA) are one of the most formidable obstacles of economic growth, that permeated the banking industry in India. It has been noticed by researchers that aggressive loan growth rate contributes to large NPAs in future. The effectiveness of a bank can be measured by its operating, profitability and liquidity ratios. While high gross NPAs (GNPAs) indicate poor asset quality, high net NPA indicate overall health of a bank. There is a close association between GNPA and liquidity ratios. The impact of the GNPA ratio on capital adequacy ratio (CAR) has a bearing. Poor operating efficiency lowers capital base and reduced profits decrease asset quality of banks (Sharma et al., 2023, p. 180).
Objective of Study
In this article, functional parameters of different banks such as ROAs, CAR, net interest margin (NIM), operating profit to working fund (OP/WF), ROE, net profit and earnings per share (EPS) following amalgamation of six major PSBs are studied. This will help assessing overall success of amalgamation efforts by the Government of India to strengthen the banking system, and growth of the economy.
Theoretical Framework
Although merger of banks is not new in India, the prospect of large-scale amalgamation of PSBs is path breaking in the sense that there was only one instance of a nationalised bank (New Bank of India) merged with PNB in 1993 and two other subsidiaries of SBI merged with the parent bank in 2008 and 2010. The current efforts of the Government are in line with Narasimham Committee recommendations of mergers and acquisitions to increase efficiency of banks. In this perspective, an empirical study is made to ascertain impact of the measure.
Research Methodology
Financial ratios such as ‘profitability ratio’, ‘solvency ratio’ and ‘efficiency indicators’ have been used to assess post-merger performance of six PSBs, where mergers took place during the relevant period (2017–2019).
Profitability Ratio
1. Return on Assets: ROA is determined by ratio of profit after tax to total assets.
2. Earnings per Share: EPS is calculated as a company’s profit divided by the outstanding shares of its common stock.
Solvency Indicators
Capital Adequacy Ratio: CAR is measured by ratio of tier 1 and tier 2 capital to risk weighted assets during the review period.
Efficiency Indicators
The following measures can be used to rate operating efficiency of a bank.
1. NIM is indicated by difference between interest income and interest expenditure. It is an indicator of a bank’s profitability and growth.
2. Operating Profit/Working Fund (OP/WF): This ratio indicates how a bank has employed its working funds in generating profit.
3. Net Profit: Profit after tax and provisions measures degree of efficiency of a company.
Analytical Framework
A comparative analysis of the post-merger and pre-merger performance of banks is made to assess the impact of bank mergers. For this reason, secondary financial data of SBI are collected for 10 years from April 2013 to March 2022, containing 5 years data during pre-amalgamation period and 5 years available data during post-amalgamation period. In case of five other amalgamated banks, namely BOB, PNB, Canara Bank, UBI and Indian Bank, secondary operational data for six years during 2017 to 2022 are obtained during pre- and post-amalgamated periods. Profitability, solvency and efficiency are measuring indicators. The financial ratios before and after merger are compared for each bank. The statistical implications of pre- and post-amalgamation years are verified through a paired student’s t-test.
The following hypotheses were tested to find out the veracity of the conclusion.
Hypotheses
H0: Post-amalgamation, PSBs posted no significant improvement in their operating performance.
H1: Post-amalgamation, PSBs posted significant improvement in their operating performance.
Discussions
Causes of Statistically Insignificant Ratios
Profitability Ratios
SBI: From Table 1, it is found that ROA and ROE of SBI indicate an average of 0.38% and 8.02% during the decade. But there is a negative correlation for ROA (−0.77) and ROE (−0.74) between pre- and post-merger periods, indicating post-merger profitability of SBI declined. The results are not significant post-merger of five subsidiaries of SBI and Rashtriya Mahila Bank Ltd (RMB) as probability values (p value) are .23 and .38, respectively. One of the factors leading to low profitability of SBI is higher provisioning due to NPA post-merger of subsidiary banks with it.
Bank of Baroda: ROA and ROE of BOB indicate an average return of 0.33% and 6.66% during the relevant period (2017–2022). There is a positive correlation for ROA and ROE between post- and pre-merger periods, indicating post-merger profitability of BOB improved. The results are significant post-merger of Vijaya Bank and Dena Bank with it as probability values (p value) are .043 and .024, respectively. Although profitability ratios improved as indicated by ROA and ROE, net profit declined post-merger, with additional NPA provision for Dena Bank, one of the banks merged with it. Subsequently, the trend was reversed in 2022.
Punjab National Bank: ROA and ROE of PNB indicate an average of 0.20% and 4.92%, respectively, during the time span (2017–2022). There is a positive correlation for ROA and ROE between post- and pre-merger periods. The probability test post-merger of UBI and OBC with PNB is significant in case of ROA (0.023) and for ROE (0.021). Although profitability ratios posted significant results, NIM and EPS did not show any significant result, following massive provisioning due to frauds.
Table 1. Annual Reports of State Bank of India (2013–2022), Bank of Baroda (2017–2022) and Punjab National Bank (2017–2022).
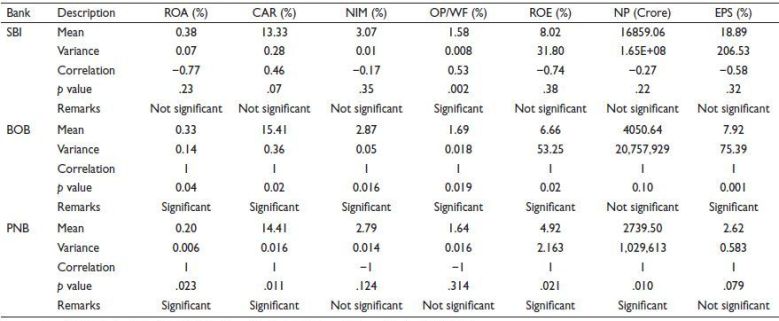
Source: State Bank of India (2013–2022), Bank of Baroda (2017–2022), Punjab National Bank (2017–2022).
Note: Calculations are authors’ own.
Canara Bank: ROA and ROE of Canara Bank indicate an average of 0.38% and 9.76% during 2017–2022. But there is a positive correlation for ROA and ROE between post- and pre-merger periods, indicating post-merger profitability of Canara Bank improved. The probability results are not significant post-merger of Syndicate Bank with it, as probability values (p value) are .11 and .10, respectively, for ROA and ROE. Although net profit rose significantly post-merger, corresponding ratios for ROA and ROE are not significant, due to reporting of net-loss during pre-merger period following additional NPA provisioning.
Union Bank of India: ROA and ROE of UBI indicate an average of 0.37% and 8.39% during 2017–2022. But there is a positive correlation for ROA and ROE between post- and pre-merger periods, indicating higher post-merger profitability of UBI. The probability results are significant post-merger of Andhra Bank and Corporation Bank with UBI as probability value (p value) is .03 and .04, respectively, for ROA and ROE. UBI profitability ratios are significant but EPS is not significant due to reporting of net-loss during the pre-merger period (2018 and 2019).
Indian Bank: ROA and ROE of Indian Bank indicate an average ratio of 0.56% and 9.98% during 2017–2022. But there is a negative correlation for ROA and ROE between post- and pre-merger periods, indicating declining post-merger profitability of Indian Bank. The probability results are not significant post-merger of Allahabad Bank with Indian Bank as probability values (p value) are .26 and .20, respectively, for ROA and ROE. Although net profit improved post-merger, it did not post significant results due to declining profit level during the pre-merger period.
Solvency Ratio: CAR
SBI: From Table 1, it is found that CAR of SBI indicates average of 13.33% during 2013–2022. The correlation between pre- and post-merger periods is positive (0.46). The results are not significant post-merger of five subsidiaries of SBI and RMB Ltd with it as probability value (p value) is .07%. Although SBI standalone results were good, post-merger CAR did not rise due to increased risk of weighted assets of its subsidiaries. SBI can maintain minimum standards in CAR as per Basel specifications prescribed by RBI although profit earnings are not-significant.
Bank of Baroda: CAR of BOB indicates average of 15.41% during 2017–2022. The correlation is positive between post and pre-merger periods, indicating post-merger increase of capital to risk weighted asset ratio. The results are significant post-merger of Dena Bank and Vijaya Bank with it as probability value (p value) is .02% (Table 1).
Punjab National Bank: CAR of PNB indicates average of 14.41% during 2017–2022. The correlation is positive between post- and pre-merger periods, indicating post-merger increase of capital to risk weighted asset ratio. The results are significant post-merger of OBC and UBI with it as probability value (p value) is .01%. (Table 1). Government also infused capital under its ‘Indradhanush’ scheme to revamp PSBs.
Table 2. Annual Reports of Canara Bank (2017–2022), Union Bank of India (2017–2022) and Indian Bank (2017–2022).
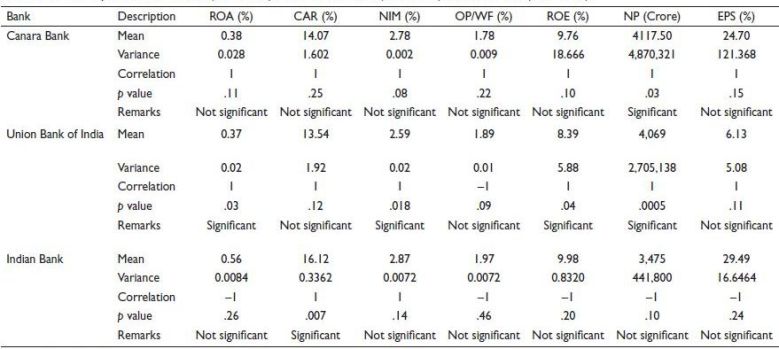
Source: Canara Bank (2017–2022), Union Bank of India (2017–2022), Indian Bank (2017–2022).
Note: Calculations are authors’ own.
Canara Bank: In Table 2, CAR of Canara Bank indicates average of 14.07% during 2017–2022. The correlation is positive between post- and pre-merger periods, indicating post-merger increase of capital to risk weighted asset ratio. The results are not significant post-merger of Syndicate Bank with it as probability value (p value) is .25%. Canara Bank can maintain minimum CAR as prescribed by RBI under Basel standards. Government also infused equity to maintain prescribed minimum capital adequacy standards.
Union Bank of India: CAR of UBI indicates average of 13.54% during 2017–2022. The correlation is positive between post- and pre-merger periods, indicating post-merger increase of capital to risk weighted asset ratio. The results are not significant post-merger of Andhra Bank and Corporation Bank with it as probability value (p value) is .12%. UBI can maintain minimum CAR as prescribed by RBI under Basel standards (Table 2). Government did contribute equity capital to UBI pre-merger of banks to meet shortfalls in capital adequacy standards, if any.
Indian Bank: CAR of Indian Bank indicates average of 16.12% during post-merger period in comparison to pre-merger time span. The correlation is positive between post- and pre-merger periods, indicating post-merger increase of capital to risk weighted asset ratio. The results are significant post-merger of Allahabad Bank with it as probability value (p value) is .007%.
Efficiency Indicators: NIM, OP/WF and Net Profit
SBI: From Table 1, it is noticed that NIM, OP/WF, net profit of SBI indicate an average of 3.07%, 1.58% and 16,859.06 (crore), respectively, for the decade (2013–2022). There is a negative correlation for NIM (−0.17), positive correlation for OP/WF (0.53) and negative correlation for net profit (−0.27) between post- and pre-merger periods, indicating post-merger profitability of SBI declined although OP/WF ratio improved. The probability tests are not significant post-merger of five subsidiaries of SBI and RMB Ltd with it, as p value for NIM is .35 and for net profit is .22. However, p value for OP/WF is significant (.002) indicating better management of working funds. Higher provisioning of bad loans is a contributing factor for insignificant ratios in NIM and net profit post-merger of banks.
Bank of Baroda: In Table 1, NIM, OP/WF, net profit of BOB indicate an average of 2.87%, 1.69% and 4,050.64 (crore), respectively, during 2017–2022. There is a positive correlation for NIM, OP/WF and net profit between post- and pre-merger periods, indicating improved post-merger profitability of BOB. The probability tests are significant post-merger of Dena Bank and Vijaya Bank with it, as p value for NIM is .016 and OP/WF is 0.019. But p value for net profit is not significant (.10) indicating lower growth rate of net profit in the post-merger period. Additional provisioning for NPAs of Dena Bank is a reason for low profit growth.
Punjab National Bank: In Table 1, NIM, OP/WF and net profit of PNB indicate an average of 2.795%, 1.64% and 2739.50 (crore), respectively, during 2017–2022. But there is a negative correlation for NIM (−1), OP/WF (−1) but positive correlation for net profit (1) between post- and pre-merger periods, indicating declining interest spread, sub-optimal use of working fund although net profit improved during period under review. The probability tests are not significant post-merger of OBC and UBI with it, as p value for NIM is .12 and OP/WF is .31. But the p value for net profit is significant (.01) indicating higher growth rate of net profit in the post-merger period, as PNB posted massive fraud loss provision during the pre-merger period.
Canara Bank: In Table 2, NIM, OP/WF and net profit of Canara Bank indicate an average of 2.78%, 1.78% and 4,117.5 (crore), respectively, during 2017–2022. There is a positive correlation for NIM, OP/WF and net profit between post- and pre-merger periods, indicating improved post-merger profitability of Canara Bank. The probability test results are not significant post-merger of Syndicate Bank with it, as p value for NIM is .08 and OP/WF is .22. Canara Bank reported net-loss during pre-merger period affecting its NIM and OP/WF ratios. However, p value for net profit is significant (.03) indicating higher growth rate of net profit in the post-merger period.
Union Bank of India: In Table 2, NIM, OP/WF and net profit of UBI indicate an average of 2.59%, 1.89% and 4,069 (crore), respectively, during 2017–2022. There is a positive correlation for NIM and net profit but negative correlation for OP/WF between post- and pre-merger periods, indicating improved post-merger profitability of UBI without optimal use of working fund to get an improved operating profit margin. The probability tests are significant post-merger of Andhra Bank and Corporation Bank with it, as p value for NIM is .018, net profit is .0005 and not significant for OP/WF is .09. It called for better deployment of resources by the bank.
Indian Bank: In Table 2, NIM, OP/WF, net profit of Indian Bank indicate an average of 2.87%, 1.97% and 3,475 (crore) during 2017–2022. There is a positive correlation for NIM (1) but negative correlation for OP/WF (−1) and net profit between post- and pre-merger periods, indicating declining post-merger profitability of Indian Bank despite improved NIM. The probability tests are not significant post-merger of Allahabad Bank with it, as p value for NIM is .14, net profit is .10 and for OP/WF, it is .46. This implies net profit is not adequate to match additional provisioning and other expenses.
From Table 3, it can be seen that the probability index of three banks for profitability is significant, while for three other banks, namely SBI, Canara and Indian Bank, it is not significant. The main reason of low profit is high NPA provisioning as can be seen from annual reports. SBI had a large operating profit of ₹75,292 crore in 2022. After NPA provision of ₹14,087 crore, net profit was reported for ₹31,676 crore. With an operating profit of ₹23,088 crore in 2022, Canara Bank made NPA provision of ₹12,772 crore for which net profit was reported at ₹5,678 crore. So also, Indian Bank reported an operating profit of ₹12,717 crore. After making NPA provision of ₹8,772 crore it had a net profit of ₹945 crore in 2022.
Similarly, solvency ratio post-merger is not significant in case of SBI, Canara Bank and UBI as they strived to maintain minimum capital adequacy norm of 12% under Basel III norms. SBI had an average CAR of 13.33% during post-merger time span. Canara Bank maintained it at 14.07%, while for Union Bank it was 13.54%.
As regards efficiency indicators, not all the six amalgamated banks showed uniform significant results post-merger, as reported in Table 3. Thus, the results are not conclusive under efficiency yardsticks. While three banks showed significant results as far as profitability and solvency are concerned, none of the banks could achieve all the parameters in efficiency indicators.
Table 3. Summary of p Value.
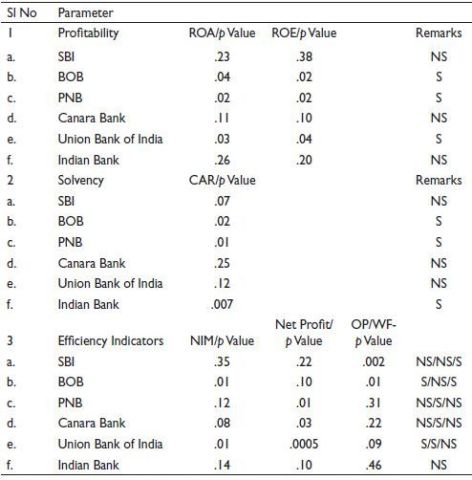
Source: Annual Reports of State Bank of India (2013−2022), Bank of Baroda (2017−2022), Punjab National Bank (2017−2022), Canara Bank (2017−2022), Union Bank of India (2017−2022) and Indian Bank (2017−2022).
Notes: Calculations are authors’ own.
S: Significant; NS: Not Significant—Compiled from Table 1 and Table 2.
So, H0 that PSBs posted no significant improvement in operating performance post-amalgamation with merged banks in case of SBI, Canara and Indian Bank under profitability parameter and SBI, Canara and Union Bank for solvency ratio may be accepted. For three other banks namely BOB, PNB and Union Bank, H1 that PSBs posted significant improvement in operating performance post-amalgamation with merged banks under profitability ratio and BOB, PNB and Indian Bank under solvency ratio can be accepted. As regards efficiency indicator, in view of mixed results, H0 that PSBs posted no significant improvement in operating performance post-amalgamation with merged banks for all six banks may be accepted.
Conclusion
Financial distress or bankruptcy has been an important driving consideration for merger of weak banks with stronger banks in India. It is pertinent to observe that all the six enlarged banks in the study lagged in achieving significant gains in efficiency parameters such as NIM, net profit, and OP/WF ratios with little variations. It indicates internal discipline is more conducive to make bank management efficient in India’s PSBs, apart from external equity support periodically to improve solvency of banks. ROAs depend on both internal policy of the bank and fiscal policy of the Government apart from trade cycles in the economy. ROE can be improved through cost management and higher non-interest income.
Managerial Implications
With these inputs, the foregoing analysis has tried to find out, whether profitability, solvency and efficiency issues can be addressed through merger of PSBs. As the Government’s headroom for higher deficit financing is reduced, scope for PSB lending is reduced. To escape from the dilemma of low profitability and high NPA call for recovery of bank dues to ensure uninterrupted credit expansion. Regulatory enforcement to improve loan recoveries in India is the need of the hour, for improved profitability, bank solvency and internal efficiency.
Limitations of the Study
Research analysis centres around operational aspects of several PSBs after amalgamation into fewer entities. However, as the size increases, the law of diminishing returns may set in, because with reduced competition, a few banks can control the economy as cartel operators. It leads to higher bank charges and lower interest for depositors (Banerjee, 2017, p. 44). However, human aspect of post-amalgamation of PSBs is not considered in this article. Employee efficiency is an important issue in bank merger and it has impact on cost considerations and social issues. Large size of a bank cannot ensure more profit without operational efficiency as evidenced from European countries. Difference in organisation culture has a bearing on merged bank. Shareholder value reacts differently post-merger of two banks (Undi & Basavraj, 2019, p. 38). With technological upgradation of banks and large-scale use of digital banking, there is scope for business diversification. More research is required in human resources and technological development of banks post-merger to mitigate the hazards of social issues.
Acknowledgement
The authors are grateful to the anonymous referees of the journal for their extremely useful suggestions to improve the quality of the article. Usual disclaimers apply.
Declaration of Conflicting Interests
The authors declared no potential conflicts of interest with respect to the research, authorship and/or publication of this article.
Funding
The authors received no financial support for the research, authorship and/or publication of this article.
Note
ORCID iD
Matruprasad Mishra https://orcid.org/0000-0002-7700-219X
Banerjee, S. (2017). Revisiting bank mergers. Economic & Political Week., LII(8), 41–48.
Bank of Baroda. (2017–2022). Annual repor. Bank of Baroda.
Bank of Baroda. (2018–2019). Annual report.Bank of Baroda.
Canara Bank. (2017–2022). Annual repor. Canara Bank.
Canara Bank. (2019–2020). Annual repor. Canara Bank.
Cuesta R A, & Orea, L. (2002). Mergers and technical efficiency in Spanish savings banks: A stochastic distance function approach. Journal of Banking and Finance, 26(12), 2231–2247.
Devi, T. R. (2015). Merger & acquisition of banks in post-reform India. Economic & Political Weekl. 50–58. www.jstor.org/stable/24482373
Habibullah, F. S. (2010 December). Assessing the impact of financial crisis on bank performance—Empirical evidence from Indonesia. ASEAN Economic Bulleti. 27(3), 245–262. https://www.jstor.org/stable/25573881
Indian Bank. (2017–2022). Annual report.Indian Bank.
Indian Bank. (2019–2020). Annual report.Indian Bank.
Krishnamurthy, R. (2017 22 July). Public sector bank mergers: A reality check. Economic & Political Weekl. LII(29), 12–15. https://www.epw.in
Lang, G., & Welgel, P. (1999, December). Mergers among German Cooperative Banks: A panel-based Stochastic Frontier Analysi. Small Business Economics, 273–286.
Lozano-Vivas, A. K. (n.d.). Consolidation in the European banking industry: How effective is it? Journal of Productivity Analysi. 36(3), 247–261. http://www.jstor.org/stable/23883801
Lukman, Y. H. (2020). Comparative effects of pre and post bank mergers and acquisitions (M&A) on employee productivity in selected banks in Nigeria. Economic Insights—Trends and Challenge. IX(LXXII)(2/2020), 35–46. https://www.researchgate.net/publication/341965152
Mohan, T. T.(2005 19 March). Bank consolidation: Issues and evidence. Economic & Political Weekl. 40(12), 1151–1161. https://www.jstor.org/stable/4416363
Punjab National Bank. (2017–2022). Annual report.Punjab National Bank.
Punjab National Bank. (2019–2020). Annual report.Punjab National Bank.
Resti, A. (1998). Regulation can foster mergers: Can mergers foster efficiency? The Italian Case. Journal of Economics and Business, 50(2), 157–169.
Sharma, P., Mishra, B. B., & Rohatgi, S. K. (2023). Revisiting the impact of NPAs on profitability liquidity and solvency: Indian banking system. IMIB Journal of Innovation and Managemen. 2, 167–180. https://doi.org/10.1177/ijim.221148863
State Bank of India. (2013–2022). Annual report.State Bank of India.
State Bank of India. (2016–2017). Annual report.State Bank of India.
Undi, R., & Basavraj, C. (2019 November). A study of mergers and acquisitions in public sector banks in India. EPRA International Journal of Multidisciplinary Researc. 5(11), 37–44. https://doi.org/10.36713/epra2013
Union Bank of India. (2017–2022). Annual report.Union Bank of India.
Union Bank of India. (2019–2020). Annual report.Union Bank of India.
Vennet, R. V. (1996). The Effect of mergers and acquisitions on the efficiency and profitability of EC credit institutions. Journal of Banking and Finance, 20(9), 1531-1558.
