1Department of Management Studies, Deenbandhu Chotu Ram University of Science and Technology, Murthal, Haryana, India
2Department of Management, Maharaja Surajmal Institute, Janakpuri, New Delhi, India
Creative Commons Non Commercial CC BY-NC: This article is distributed under the terms of the Creative Commons Attribution-NonCommercial 4.0 License (http://www.creativecommons.org/licenses/by-nc/4.0/) which permits non-Commercial use, reproduction and distribution of the work without further permission provided the original work is attributed.
In recent years, sensory marketing, particularly in the context of atmospheric and ambient environments, has witnessed substantial growth in research activities. However, despite this proliferation of studies, there has been a lack of comprehensive scientific mapping in this domain. To address this gap, this study employs bibliometric analysis to examine the body of research in sensory marketing. Data were extracted from the Scopus database using article classification, a journal coverage criterion. The analysis used the Biblioshiny application within the bibliometric package developed in R-Studio and VOS Viewer. The findings indicate an exponential growth in research within this field, with most publications originating from the United States of America and China. Key topics that emerged prominently in this research include ‘sensory marketing’, ‘sensory brand experience’, ‘customer satisfaction’, ‘five senses’, and ‘aesthetics’. In this article, the core elements of sensory marketing are defined as ‘background music’, ‘advertising’, and ‘sensory brand experience’, offering valuable insights for marketers seeking to leverage sensory marketing for long-term benefits. The study makes a variety of contributions. It details the development of sensory marketing during the last few decades. In conclusion, sensory marketing is a complex strategy that harnesses the power of the human senses to provide memorable brand experiences. The study shows the scope of assisting future digital sensory marketing in shaping consumer perceptions and preferences and understanding cross-cultural marketing in the increasing landscape of digital sensory marketing.
Sensory marketing, five senses, consumer behaviour, multisensory marketing, bibliometric
Introduction
Consumer behaviour often centres on emotional responses and post-usage feelings, reflecting a fundamental aspect of human nature (Dissabandara & Dissanayake, 2019). The term ‘sensory marketing’ emerged as an acronym to encapsulate studies exploring the influence of feelings on consumption outcomes (Krishna, 2010, p. xii). Sensory marketing, a strategic approach, capitalises on human senses to craft memorable and emotionally resonant consumer experiences. By providing multisensory stimuli at the point of sale, sensory marketing methods are utilised to generate positive reactions from customers, speeding up the decision-making process (Antunes & Veríssimo, 2024; Kim et al., 2021) and enhancing their experience (Antunes & Veríssimo, 2024; Wörfel et al., 2022). Diverging from conventional marketing tactics, it integrates sensory elements like sight, sound, smell, taste and touch into branding and communication. This holistic approach deeply engages customers, leaving enduring impressions and fostering brand loyalty. Companies can effectively cultivate hedonic value and competitive advantages by appealing to their customers’ senses. Consequently, many businesses, goods and services adopt sensory experience platforms (Pine & Gilmore, 1998). Historically, marketing researchers heavily relied on information-processing models (Bettman, 1979), often neglecting the role of the five senses (Hultén, 2015). However, sensory factors significantly influence consumer judgement and behaviour (Holbrook & Hirschman, 1982). In recent years, sensory marketing has gained prominence as scholars and marketers recognise the profound impact of sensory stimuli on consumer behaviour. Drawing insights from psychology, neuroscience and consumer behaviour, this approach delves into how sensory cues shape perception and decision-making. Psychologists have found that cognition is grounded in bodily sensations rather than being independent of perceptual modalities (Barsalou, 1999). In marketing, researchers investigate how consumers’ perceptions of products and shopping environments impact their decision-making (Krishna, 2012). As there is still much work to be done on sensory marketing, it is crucial for businesses seeking to connect with consumers on a deeper level, create memorable brand experiences and gain a competitive advantage in today’s dynamic marketplace.
This study is necessary since customer behaviour and marketing tactics are changing in today’s fast-paced industry. Businesses looking to establish enduring brand experiences and a stronger connection with their audience must fully grasp and utilise the power of sensory marketing, as emotional reactions and post-usage sentiments increasingly shape consumer behaviour. This study aimed to quantitatively map the landscape of sensory marketing research and delve into 25 key papers in the field. Its primary objectives were identifying crucial sensory marketing elements from existing literature, tracking emerging trends, determining the most frequently cited paper, and fostering collaboration among authors and countries. The findings underscore a significant upsurge in sensory marketing research over recent decades, with approximately 2000 papers published across business, economics and decision-making domains. Comprehensive studies that map the research landscape in this discipline identifies significant trends and highlight seminal publications are necessary as sensory marketing gets traction. This study uses statistical analysis of recent literature and relevant documents to bridge this gap and provide practitioners and scholars with helpful information.
Bibliometric Analysis
Studies on bibliometric analysis examine trends in previously published literature using mathematical and statistical methods (Singh & Dhir, 2019). A bibliometric study can yield various indicators, including university productivity. Furthermore, it provides insights into co-authorship patterns among journals, countries and universities (Avilés-Ochoa et al., 2021). Bibliometric analysis typically measures productivity by quantifying the number of publications, while the number of citations often gauges the influence of research (Merigo et al., 2018). The widely used h-index is a popular indicator combining publications and citations into a single measurement. Alternatively, researchers may also assess productivity using metrics such as the citation-to-papers ratio or the impact factor, which calculates the mean number of citations per paper (Olheten et al., 2005). With an ever-increasing number of publications, the area of sensory research must be given a meta-perspective. This study attempts to close the considerable gap in the area by doing a complete bibliometric analysis of the field of sensory marketing.
The following research question is addressed here:
RQ1- Which research area of sensory marketing has already been done, and which are the most influential authors, keywords and countries?
RQ2- How did the research evolve over this period, and what are the future research areas in sensory marketing?
Research Methodology
Bibliometric studies employ quantitative analysis to explore a specific body of literature by examining bibliographic characteristics (Hawkins, 1997). Also, bibliometric analysis involves examining citations within scholarly publications through various frameworks, tools and methodologies (Debicki et al., 2009; Ferreira et al., 2019; Duhoon & Singh, 2023). This practice has spurred the creation of diverse metrics aimed at unveiling the intellectual fabric of a vast academic domain and assessing scientific journals, research endeavours and researchers accordingly (Rani & Salanke, 2023). By employing bibliometric analysis, a researcher can statistically investigate the relationships between citing and cited papers (Lawani, 1981; Fouroudi et al., 2020). Consequently, bibliometric methods are highly suitable for mapping the research landscape within sensory marketing (Krishna, 2012). The co-citation technique offers the advantage of identifying articles of significant research value and elucidating their connections. This study utilises a co-citation matrix to provide a symmetrical representation of the values associated with paired co-cited articles (Culnan, 1987).
The first step of this study is to identify which data collection database is to be followed based on a specific search strategy.
Search Strategy and Data Retrieval Process
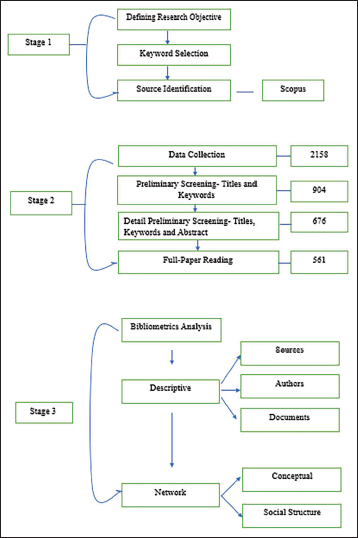
As shown in Figure 1, identifying an appropriate database was the first step in the data-gathering procedure for this project. A query was then developed using appropriate keywords for the study to ensure thorough coverage. Once the database was chosen, the study utilised software tools and relevant inclusion and exclusion criteria were set. The data processing tools’ janitor function in R-Studio was then used to clean the data. Records that did not fit specific requirements were eliminated throughout the data-collecting stage. These requirements included articles written outside of English, without peer review, outside of marketing, consumer behaviour, or business research domains and without addressing a sensory marketing-related study question. This intensive screening procedure has ensured the quality and applicability of the dataset for further research. Moreover, network maps were created to improve data visualisation and reveal the conceptual, intellectual and social patterns present in the collection. A more significant hold of the study environment in sensory marketing was made possible by these maps, which offered insightful information about the relationships between writers, papers and sources (Aria & Cuccurullo, 2017).
Figure 1. Flowchart for the Selection of the Document for Bibliometric Analysis.
Source: Bhatia et al., 2021.
Database Selection
Choosing the appropriate database is crucial for bibliometric analysis. Scopus was selected due to its comprehensive coverage of scholarly journals across various disciplines, making it suitable for capturing a broad spectrum of research relevant to sensory marketing. Additionally, Scopus is compatible with R-studio’s bibliometric software and VOS Viewer, facilitating seamless data extraction and analysis.
Data Preparation
Upon selecting Scopus, data extraction was conducted in CSV format to ensure compatibility with the chosen analytical tools. This involved retrieving metadata such as publication titles, authors, keywords and citation counts. Subsequently, documents were screened and shortlisted based on predefined search criteria established on 05-07-2023, ensuring relevance to the study objectives.
Keyword-based Search Strategy
A comprehensive search strategy was developed using prominent keywords associated with sensory marketing research. These keywords included ‘sensory marketing’, ‘five senses’, ‘sensory aesthetics’, ‘consumer behaviour’, and ‘store atmospherics’. By incorporating relevant terms, the search strategy aimed to capture diverse literature relevant to sensory marketing.
Search Approach
The search strategy employed a Boolean logic-based approach to effectively combine and refine search terms. Specifically, the search query utilised the logical operators ‘AND’ and ‘OR’ to retrieve articles encompassing the intersection of relevant topics. This approach ensured that retrieved documents were highly relevant to the study’s focus on sensory marketing, sensory brand experiences and consumer behaviour.
Timespan Selection
To provide a comprehensive overview of the evolution of sensory marketing research, the study encompassed a significant time span from 1990 to 2022. This extended period allowed for the identification of trends, patterns and shifts in research focus over time, providing valuable insights into the development of the field. Additionally, it ensured the inclusion of seminal works and foundational literature that have contributed to shaping the landscape of sensory marketing.
Data Analysis and Findings
Scientific mapping and descriptive analysis were used to analyse the data (Figure 1).
The general specifications of the data set, for example, (a) documents, (b) authors and (c) sources/journals, are focused upon when conducting descriptive analysis of the bibliometric data
Using visualisation methods, such as three-field plots and network analysis, facilitates further analysis as part of scientific mapping, which requires extensive science mapping for deriving the knowledge structures.
Data extraction from the complete texts of each study incorporated into the systematic review encompassed various elements. These extracted data encompassed the study’s key findings pertinent to its research questions, the identity of the author(s), the specific research question(s) addressed within the study, the study’s title, the year of publication and the name of the publication. These data served as the foundational basis for the subsequent analysis.
Among the 561 articles subjected to analysis, they had initially appeared in 263 distinct journals, books and related publications. Notably, a significant concentration of these 561 surveyed articles emanated from journals specialising in marketing, signifying robust strength in this domain. Additionally, various articles were dispersed across journals covering broader subjects, including economics, production, management and business.
Descriptive Analysis
Data Set.
A comprehensive overview of the bibliometric dataset is provided in Table 1, consisting of 561 carefully chosen papers found using a methodical search query on the Scopus database. These materials have an average reference score of 28.81 and come from 263 distinct publications. The international cooperation index, which stands at 21.57 and indicates significant research collaboration among researchers across many geographical locations, is remarkable. This partnership demonstrates the international scope of sensory marketing research and the range of viewpoints and specialities that have aided its development. Additionally, the dataset’s diversity illustrates the multidisciplinary character of sensory marketing research, which incorporates knowledge from various disciplines, including psychology, marketing, neuroscience and consumer behaviour.
The three-field plot (Figure 2) employs Sankey plots to elucidate further the relationships among various elements, where the node’s value is proportionate to its size (Riehmann et al., 2005). In this visualisation, authors are depicted on the left portion of the plot, keywords are represented in the middle, and the chosen sources for the review are positioned on the right. Within this framework, 25 keywords of significance, such as ‘sensory marketing’, ‘background music’, ‘touch’, ‘advertisement’, ‘color’, ‘sensory perception’, ‘sensory brand experiences’, and ‘aesthetics’, are associated with their respective sources and profiled authors. It is noteworthy that all 25 influential journals encompass the overarching theme of ‘sensory marketing’, with a distinct emphasis on subtopics like ‘mental imagery’, ‘five senses’, ‘customer satisfaction’, ‘perception’, and ‘consumer behaviour’, underscoring their pivotal role in this research domain.
Sources.
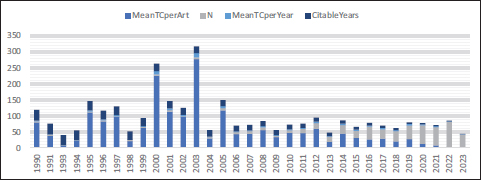
A notable upward trend is evident from 1990 to 2023, as in the scientific productivity chart (Figure 3). Including variables like mean total citations per article, mean Figure 3 provides a detailed summary of the citation patterns for articles released between 1990 and 2015, including total citations per year, number of publications and citable years. Mean total citations per year normalises this number across time, whereas mean total citations per article illustrates the average impact of citations on publications in a certain year. Citable years show the length of time a work has been cited, whereas the total number of papers shows how many publications there have been. Combined, these measures provide insightful information on the lifespan and effect of research outputs over a 25-year period through citations, which helps explain patterns in the field’s academic influence.
Figure 2. Three-field Plot.
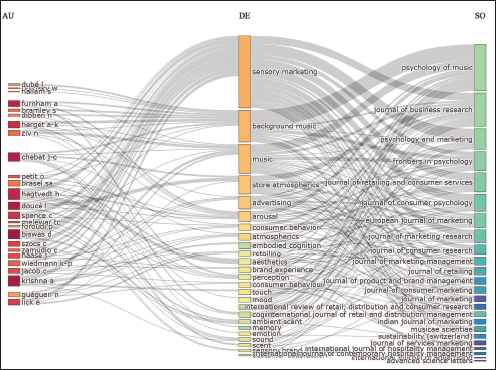
Figure 3. Scientific Production Chart.
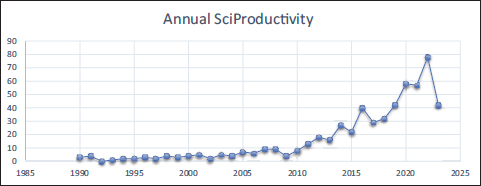
There is a substantial surge in research output, particularly after 2009, which can be attributed partly to the increasing focus on studies related to sensory marketing and consumer behaviour. Additionally, average citations experienced a significant increase in the year 2023, as depicted in Figure 4. Despite the continuous growth in the number of publications on this topic, it is essential to note that the field has not yet matured.
Figure 4. Average Citation Chart.
Impact of Journals.
The h-index and g-index are used in bibliometrics to quantitatively assess academic journals’ influence. With an h-index of 20 and a g-index of 31, for example, the Journal of Business Research stands out due to its significant productivity and extensive citation effect. With an h-index of 13 and a g-index of 24, the Psychology of Music magazine, in contrast, exhibits a notable scholarly influence within its specialised field. These metrics help researchers identify essential articles; for instance, the Journal of Consumer Psychology has an h-index of 13, highlighting its importance in consumer behaviour research. These quantitative evaluations influence funding decisions, publication choices and the general knowledge of the effect of research and academic communication (Table 2).
Authors.
The most number of publications in the field were produced by Biswas, Krishna and Spence (Figure 5). Biswas and Krishan have more than ten articles published in this field. An impact factor (h-index) analysis shows they are the authors most impacted. Their output is seminal. In this domain, these articles are essential from a future research perspective. Most articles written by author D. Biswas (9) are in the lead, followed closely by A. Krishna (8) and L. Doucé (7). This analysis sheds light on specific authors’ scholarly influence and involvement while revealing their prolificacy and contributions within their respective domains.
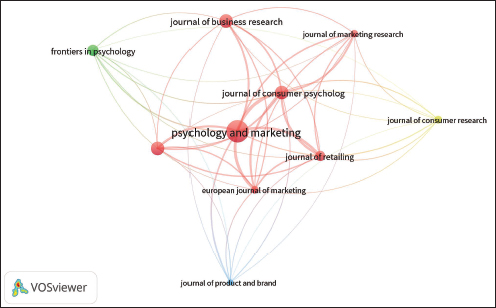
Figure 6 depicts the journals that have published most research articles in the field of sensory marketing. The journal with the maximum number of publishings is Psychology and Marketing, with a contribution of 41 articles, followed by Journal of Business Research, with 31 articles; Journal of Consumer Psychology, with 24 articles; and also, there are other journals like the Frontier of Psychology, journal of retailing, European journal of marketing, etc. As depicted in this figure, Psychology and Marketing exhibit the highest number of publications. The most frequently cited journals encompass those with specific focus, such as advertising, and those engaging in interdisciplinary research, such as consumer studies. A greater diversity of journals covering the research domain implies a wide range of research topics and underscores the multidisciplinary research domain implies a wide range of research topics and underscores the multidisciplinary nature of this field of inquiry (Low & Siegel, 2019)
Figure 5. Most Relevant Author’s Chart.
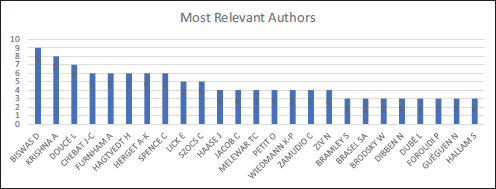
Figure 6. Top 25 Most Relevant Sources.
Country-wise Contribution.
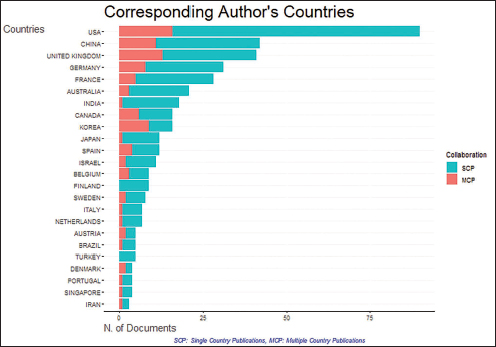
Table 3, for most of the literature in this area, found that developed countries contributed the most, which was found from the commitment of various nations to this field. Most of the distributions nearby were in the USA with a frequency of 299, while the United Kingdom was a distant second, but China’s frequency of publication (130) in the area is higher. The number of citations received by articles depends on the volume of publications within the specific field. The prominence of research activity within the USA region is underscored by the fact that it accounted for approximately 70% of the total citations received in the field. Additionally, bibliometric data unveiled that the USA surpassed other regions regarding citation reception, with the UK, France and Canada. These countries, while noteworthy, received comparatively fewer citations in total.
Institution Wise.
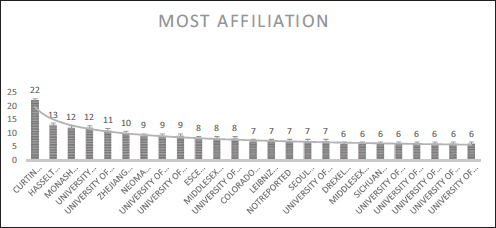
Figure 7 shows each institution’s affiliations and for each institution, along with the total number of papers linked to it. Each row represents a distinct academic institution, and the number in the ‘Articles’ column corresponds to the number of publications related to that specific university. Curtin University, for instance, has the most papers—22—followed by Hasselt University and Monash University, which have 13 and 12 articles, respectively. This breakdown, which reflects the varied institutional and geographic location of research communication and cooperation, provides insights into the contribution of different academic institutions to research output within the designated categories.
Figure 7. Most Relevant Affiliation Chart.
Documents.
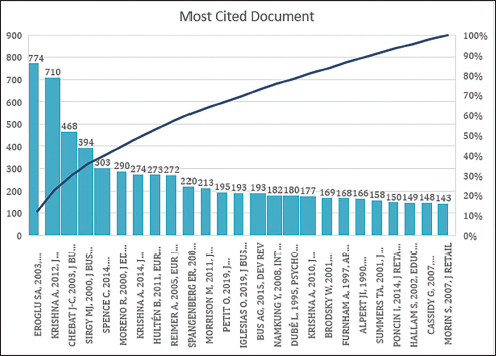
Figure 8 presents this field’s 25 most cited documents. More than 100 citations were received from all these articles. Indicating the most cited document (774), Eroglu et al. (2003) authored the top four publications. Krishna (2012), with more than 700 citations, and Chebat (2003), with around 500 citations, were the articles with the maximum citations in the field. This article discusses the importance of sensory marketing and its impact on consumer behaviour. The critical reference articles in the field can be considered as the ones that were the most cited articles.
Figure 8. Most Cited Document.
Keywords.
The recurrence with which the catchphrases were utilised in the articles showed that the expression ‘tangible showcasing’ seemed multiple times, trailed by ‘background music’, ‘music’, ‘store atmospherics’, ‘advertising’, ‘arousal’, ‘atmospherics’, ‘shopping experiences’, ‘emotions’ and ‘aesthetics’. The word cloud addressed in Figure 9 is a visual portrayal of the recurrence of the words in the report, shown by the size of the word. It tends to be utilised as an intermediary for the significance of the word in writing. There has been a sensational expansion in the frequencies from 2015 onwards. Various antecedents that could be inferred from this word cloud have been explored, including studies of sensory marketing like brand experience, sensory brand experience and mental imagery. Most of them dealt with understanding the consumer behaviour of buying the product with their senses.
As seen from the analysis of the articles, the frequency of the keywords used showed that the term ‘sensory marketing’ appeared 142 times, followed by ‘background music’, ‘products’, ‘brand experience’, and ‘sensory brand experience’. As shown by the word size, the word cloud addressed in Figure 10 shows the recurrence of the words in the record through a visual portrayal. It very well may be utilised as an intermediary for the significance of the word in writing. Aside from these, supposedly, it was predominant. From 2015 onwards, there has been a phenomenal increase in the frequencies. Various antecedents have been explored, which could be inferred from this word cloud that these studies of sensory marketing, like experiential marketing and brand experience.
Figure 9. Most Relevant Words.
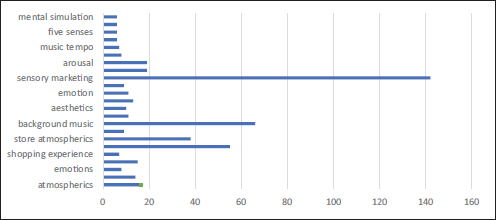
Figure 10. Word Cloud for Sensory Marketing.
Data Visualisation
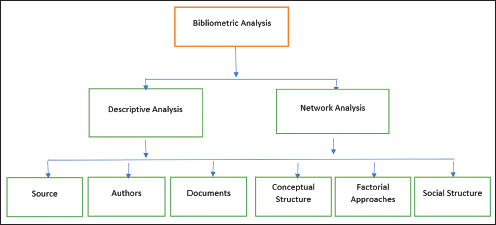
In recent years, there has been an upward trend in study interest and concentration on sensory marketing and understanding consumer behaviour experiences. A thematic progression of the field is shown in this section. In information representation, network analysis is used to quantify the number of emanant bunches, the events and connections between different research units, the general quality of connections and the number of citations. To extract the networks, several methods based on different analytic units—such as documents, authors and keywords—must be developed. Connections connect nodes in these networks. It conducts factual analyses of maps designed to display different organisational proportions (Aria & Cuccurullo, 2017). The logical planning done through the organisation examination comes full circle in three information structures: precisely reasonable construction, scholarly design and social construction (Figure 11).
Figure 11. Bibliometric Analysis Levels.
Source: Aria, M., & Cuccurullo, C. (2017). Bibliometrics: An R-tool for comprehensive science mapping analysis. Journal of Informetrics, 11(4), 959–975.
Conceptual Structure
The reasonable design demonstrates how themes, subjects and patterns are related through co-event organisations or co-word research. This is the only way that the information in research articles is used. Consequently, an idea, a subject, or a set of widely used phrases constitute the unit of study. The Bibliometric programme determines this conceptual framework of the study field using multiple correspondence analysis (MCA). Multivariate nominal data may be graphically and numerically analysed using MCA (Greenacre & Blasius, 2006; Ingale & Paluri, 2020).
Co-occurrence Network
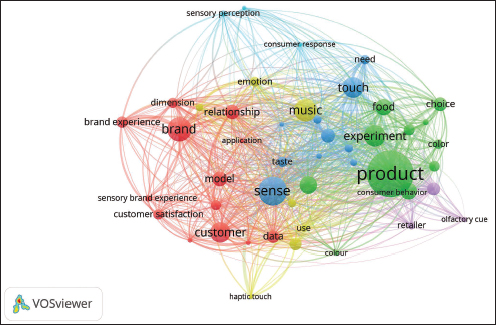
According to Figure 12, the author’s analytical keywords’ keyword co-occurrence network was created using Louvain’s 50-node clustering method with automated layout by default, normalisation by association, and normalisation by association. The terms known as ‘author’s keywords’ were derived by a computer program using frequently occurring words in document titles and reference lists. They are predisposed to do this because they more thoroughly and accurately capture archival data (Garfield & Sher, 1993; Zhang et al., 2016). The information was used to create the four bunches shown in Figure 13 in red, purple, green and blue. Different colours represent these clusters; relatedness is shown by distance; words serve as the vertex, and the size of the node is commensurate to the frequency of the cluster. The red cluster emphasises brand experience, the blue cluster combines consumer behaviour, memory and perception, and the green cluster emphasises elements influencing consumer decisions, including music, pace and touch. The purple cluster is dominated by sensory marketing.
Figure 12. Co-occurrence Network.
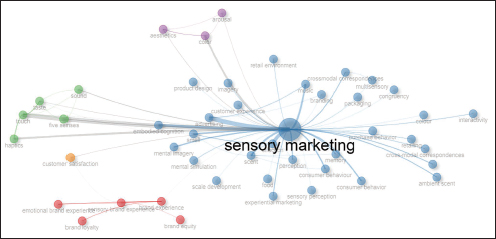
Figure 13. Time Slice 3- 2018–2020.
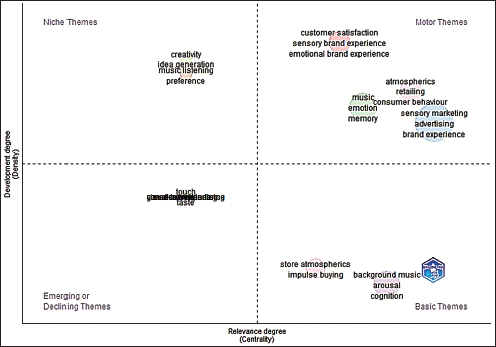
Trend Topics
Analysing popular subjects throughout time shows significant connections between topics. A logarithmic scale is used to plot the recurrence of key themes against distribution years in Figure 14. Analysing the last 5 years (2014–2022) reveals an engaging story. The conversation between 2014 and 2016 focused on atmospherics, shopping behaviour, and shopping experiences, suggesting that an emphasis on comprehending customer interactions and preferences within retail environments was present. Scent, music and shop atmospheres received more attention between 2016 and 2018, indicating a rising interest in the sensory elements of the retail environment and how they affect customer perceptions. From 2018 to 2020, cross-modal correspondences, aesthetics, background music and sound themes became popular subjects, highlighting how sensory cues are related and influence consumer behaviour. A behavioural approach was also stressed when analysing these occurrences. A discernible movement in strategy toward using tactile sensations and multisensory stimuli to engage customers better was shown in 2020 by the trend toward sensory marketing, touch and advertising. Ultimately, conversations in 2021–2022 focused on perception, mental stimulation, haptics and mental imagery, showing an increasing understanding of the influence of psychological and cognitive processes on customer behaviour in retail settings.
Thematic Map.
Typological themes are visually represented on a two-dimensional thematic map, as introduced by Cobo et al. (2011). Keyword clusters are identified through co-word analysis to construct these themes within the research domain. These themes are then classified into four quadrants on a two-dimensional graph, with density and centrality as the two defining dimensions. Each theme is depicted on the map as a bubble.
Figure 14. Trending Topics.
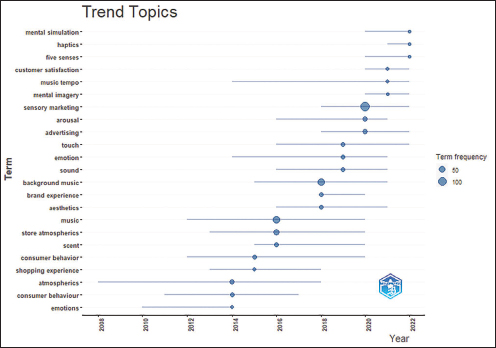
Figure 15. Thematic Map.
In Figure 15, bubbles represent the key themes such as ‘Sensory Marketing’, ‘sensory brand experience’, ‘customer satisfaction’, ‘five senses’, and ‘aesthetics’. The top right quadrant hosts the dominant theme, ‘multisensory’, characterised by its high density and centrality, signifying its central and extensively explored status within the discipline.
The theme ‘tangible promoting’ in the lower right quadrant is positioned, indicating its significance and highlighting that it requires further development.
The upper left quadrant features the niche theme ‘consumer experience’, which, despite being well-developed internally, possesses weak external connections and holds marginal importance.
Finally, the lower left quadrant encompasses the theme ‘neuroscience’, which is less essential and relatively developed, reflecting emerging and diminishing connections within the field (Aria & Cuccurullo, 2017; Huang et al., 2020).
Thematic Evolution.
Researchers have divided the total duration into discrete eras to understand the discipline’s development. This method enables us to look at advances in various topics and analyse how the field has changed over time. It uses a methodology based on the density and centrality of field components and keywords Della Corte et al., 2019).
Figure 16. Thematic Evolution-three-field Plot.
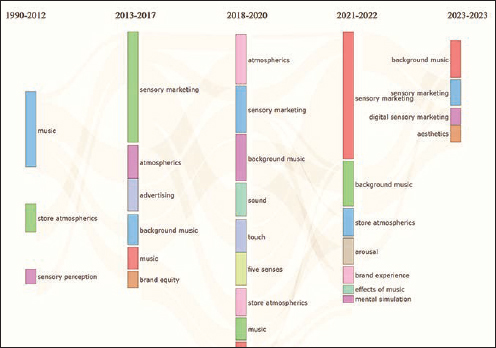
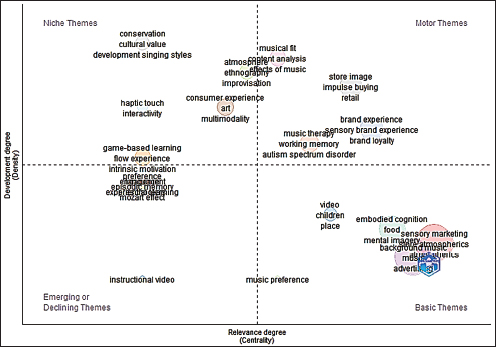
A theme evolution analysis is utilised in our study to find keywords with a minimum group size of five, with an emphasis on a 400-word count inside the field (Figure 16). Separated by cutoff years in 1990 and 2023, we have separated the analysis into three temporal periods. Using this methodical approach, we can systematically look at themes and concepts and see how the area has developed over time (as illustrated in Figure 13, Figures 16–20). The authors who participated in Time Slice 1 concentrated more on sensory marketing, sensory perception, shop atmospheres and other related themes (Figure 17); in Time Slice 2, however, they also concentrated on brand equity, advertising, sensory brand experiences and other related topics (Figure 18). Time Slice 3 focused on creativity, impulse buying, emotional brand experiences, idea generation and retailing (Figure 13); this also led to augmented reality, mental simulation, brand loyalty and the impact of music (Figure 19); Time Slice 5 focused on digital sensory marketing, mental imagery and aesthetics (Figure 20).
Factorial Analysis.
The factorial analysis-defined research clusters and the participants investigated within each are shown in Figure 21. Though overall, there is not much of a link between the clusters, several phrases stick out, like ‘brand experience’, ‘sensory brand experiences’, and ‘sensory perception’. Despite not having many relevant research articles specifically addressing these subjects, these phrases suggest that the academic community is still actively engaged in such study.
The goal of SNA was to promote connections within the topic of the study area. Hubs recommend entertainers, venues, distributors, or producers, for instance, and many show the related ties inside the unofficial organisation. These places are connected by linkages that address the components of the organisation. Geological diversity and teamwork were investigated using collaboration networks created in light of 24 countries (Figure 22). Concerning publishing production, the United States is the leading contributor with the most publications, holding the top spot. The United Kingdom comes in second place, followed by France, which comes in third place. The above list highlights the noteworthy research endeavours and noteworthy contributions made by these nations to the discipline. From a provincial viewpoint, the USA overwhelms the insightful request and collaborates with many European nations and emerging economies. Variety in the information base is concentrated thoroughly through bunch examination. Assuming that a report is related to a specific group, inside that bunch, the texts are firmly connected through standard references (Aria & Cuccurullo, 2017). There were strong collaborations between researchers from the USA and scholars from China, the United Kingdom and Germany. In the second cluster, the domination is by China in association with India, France, Canada and Australia (Figure 23). UK, South Korea, Netherlands, Italy and Spain led the third cluster.
Figure 17. Time Slices 1- 1990–2012.
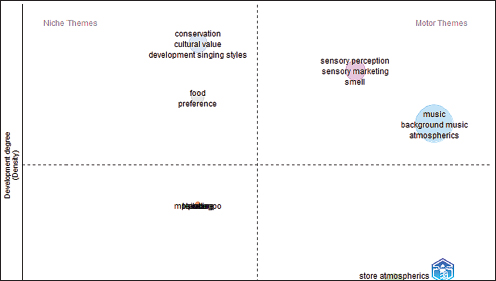
Figure 18. Time Slices 2- 2013–2017.
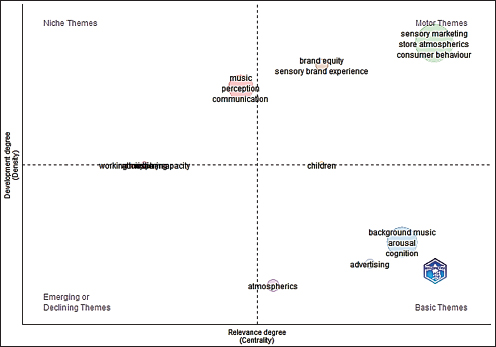
Figure 19. Time Slice 4- 2021–2022.
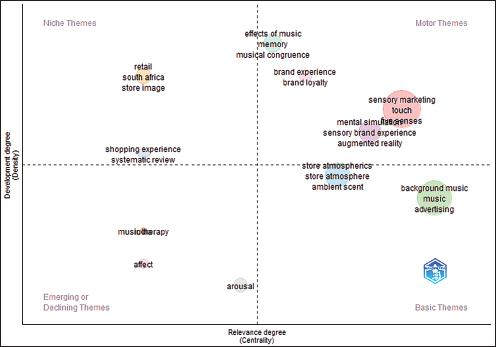
Figure 20. Time Slice 5- 2023–2023.
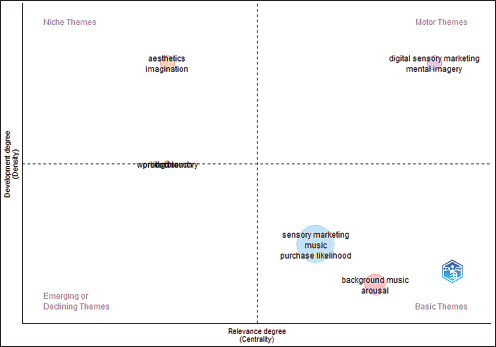
Figure 21. Bibliometrics Conceptual Structure Map—-Factorial Analysis.
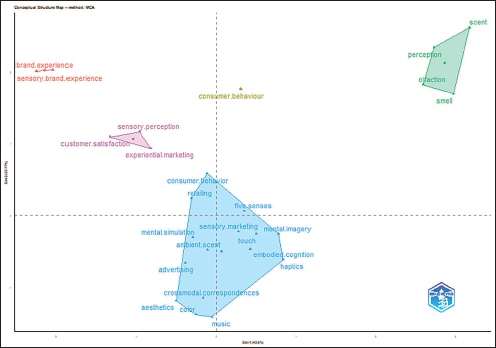
Figure 22. Geographical Collaboration Network.
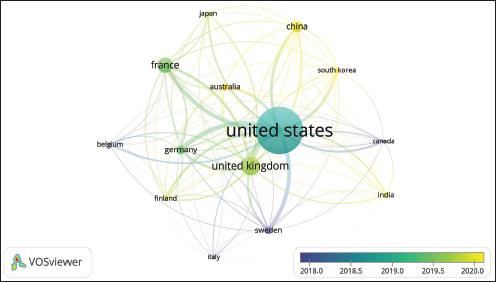
Figure 23. Corresponding Author’s Countries.
Conclusion
Theoretical Implication
The discipline of sensory marketing research has advanced significantly with the publication of this article. Although sensory marketing has been the subject of previous literature reviews, this one stands out for its creative application of bibliometric tools to synthesise and consider 33 years of research through a transdisciplinary methodology encompassing business, management, accounting, social sciences and psychology, the research endeavours to comprehend theoretical and topical concerns related to sensory marketing thoroughly. This inquiry takes a new strategy by using bibliographic coupling analysis, in contrast to other studies mainly concentrating on co-citation analysis. Finding insights beyond brand encounters, this approach enables the collection of more distinct data and offers a focused synopsis of sensory marketing. Additionally, by broadening the scope of the analysis to encompass almost five decades of research, the study provides a more thorough understanding of the field’s historical development. The study finds four unique quadrants within the literature on sensory marketing: digital sensory marketing, visual sense, consumer experience and neuroscience in customer encounters. Future study options are presented by each cluster, ranging from examining how digitalisation affects customer experiences to examining the function of taste in online purchasing environments. Through fostering cooperation with disciplines such as neurology, psychology and biology, the project seeks to further our knowledge of sensory marketing and open up novel avenues for investigation.
Practical Implications
The study aims to provide an in-depth evaluation of current sensory marketing knowledge, establishing an outline for practitioners and academics. This roadmap aims to help marketers use sensory marketing strategies more successfully. Additionally, the study verifies the efficacy of sensory marketing with real-world examples, such as Spence’s results on the influence of sensory cues on restaurant dining experiences and Krishna’s research showing how multimodal marketing improves product assessment and decision-making. Sensory marketing encompasses several fields, such as psychology and biology. Marketers must carefully craft strategies to influence customer behaviour, especially internet buying. As digital encounters increasingly supplant physical ones, organisations find it challenging to establish effective bonds with customers (Petit et al., 2019). Moreover, authenticity is essential in both online and offline interactions. The study’s clusters provide valuable insights into developing trends and the possibilities of new technologies, particularly in digital sensory marketing. Furthermore, by comprehending multimodal interactions, practitioners may better utilise sensory signals in the design of their products, environments and marketing campaigns. Through global and cross-cultural observations—which included identifying China and the United States as the two most prominent countries in sensory marketing publications—the research offers actionable advice for businesses looking to comprehend the viewpoints of their global clientele and successfully negotiate cross-cultural marketing strategies. Finally, the study highlights how sensory marketing significantly impacts customer behaviour and how useful it is to use sensory components to create memorable brand experiences.
Limitations
The exploration was restricted to a survey of reports from the Scopus information base and bibliometric analysis, focusing on sensory marketing. Scopus is a dynamic database that continually updates. Search results may change when research is published, emphasising the need for awareness of this database’s evolving nature. In order to predict future trends and create new models in sensory marketing, an empirical study can be conducted. The themes identified include digital sensory marketing, aesthetics, sensory perception, atmospherics, game-based learning and touch experience. These subjects will probably lead to future exploration of tactile showcasing and might increase the value of researching their significance to advertisers observationally.
Future Research Directions
Gaps identified are presented in this section, which lay the path for future research. Customer involvement and affective commitment are critical to the success of sensory marketing (Dessart et al., 2016). Although sensory marketing has received sufficient attention, more in-depth research on multisensory experiences from the viewpoint of the customer is still needed. Future studies might examine the cultural and regional variations in consumers and the effectiveness of marketing tactics, as well as the ways in which these variations can be accounted for through multisensory experiences. Additionally, as digital sensory marketing has gained prominence, it is crucial to explore how emerging technologies shape consumer perceptions and preferences in this context, as technology significantly influences consumer behaviour and decision-making. This research can contribute to a deeper understanding of the complexities of cross-cultural marketing and the evolving landscape of digital sensory marketing.
Declaration of Conflicting Interests
The authors declared no potential conflicts of interest with respect to the research, authorship and/or publication of this article.
Funding
The authors received no financial support for the research, authorship and/or publication of this article.
ORCID iDs
Rupa Rathee  https://orchid.org/0000-0003-3102-1413
Monika Singh  https://orcid.org/0009-0007-1309-8130
Pallavi Rajain  https://orcid.org/0000-0002-6113-1026
Antunes, I. F. S., & Veríssimo, J. M. C. (2024). A bibliometric review and content analysis of research trends in sensory marketing. Cogent Business & Management, 11(1), 2338879.
Aria, M., & Cuccurullo, C. (2017). bibliometrix: An R-tool for comprehensive science mapping analysis. Journal of Informetrics, 11(4), 959–975.
Avilés -Ochoa, E., Flores-Sosa, M., & Merigó, J. M. (2021). A bibliometric overview of volatility. Journal of Intelligent & Fuzzy Systems, 40 (2), 1997–2009.
Barsalou, L. W. (1999). Perceptual symbol systems. Behavioral and Brain Sciences, 22(4), 577–660.
Bettman, J. R. (1979). Memory factors in consumer choice: A review. Journal of Marketing, 43(2), 37–53.
Bhatia, R., Garg, R., Chhikara, R., Kataria, A., & Talwar, V. (2021). Sensory marketing—A review and research agenda. Academy of Marketing Studies Journal, 25 (4), 1–30.
Chebat, J.-C. and Michon, R. (2003), Impact of ambient odors on mall shoppers’ emotions, cognition and spending: a test of competitive causal theories, Journal of Business Research, 56(7), 529–539.
Cobo, M. J., López-Herrera, A. G., Herrera-Viedma, E., & Herrera, F. (2011). Science mapping software tools: Review, analysis, and cooperative study among tools. Journal of the American Society for Information Science and Technology, 62(7), 1382–1402.
Culnan, M. J. (1987). Mapping the intellectual structure of MIS, 1980-1985: A co-citation analysis. Mis Quarterly, 11(3), 341–353.
Della Corte, V., Del Gaudio, G., Sepe, F., &Sciarelli, F. (2019). Sustainable tourism in the open innovation realm: A bibliometric analysis. Sustainability, 11(21), 6114.
Dessart, L., Veloutsou, C., & Morgan-Thomas, A. (2016). Capturing consumer engagement: Duality, dimensionality and measurement. Journal of Marketing Management, 32(5/6), 399–426.
Debicki, B. J., Matherne, C. F., Kellermanns, F. W., & Chrisman, J. J. (2009). Family business research in the new millennium: An overview of the who, the where, the what, and the why. Family Business Review, 22(2), 151–166.
Dissabandara, D. R., & Dissanayake, R. (2019). Theoretical overview on sensory marketing. International Journal of Current Research, 11(07), 5361–5364.
Duhoon, A., & Singh, M. (2023). Corporate governance in family firms: A bibliometric analysis. Management, 1, 22.
Eroglu, S. A., Machleit, K. A., & Davis, L. M. (2003). Empirical testing of a model of online store atmospherics and shopper responses. Psychology & Marketing, 20(2), 139–150.
Ferreira, J. J. M., Fernandes, C. I., & Kraus, S. (2019). Entrepreneurship research: Mapping intellectual structures and research trends. Review of Managerial Science, 13(1), 181–205.
Fouroudi, P., Kitchen, P. J., Marvi, R., Akarsu, T. N., & Uddin, H. (2020). A bibliometric investigation of service failure literature and a research agenda. European Journal of Marketing, 54(10), 2575–2619.
Fürst, A., Pecornik, N., & Binder, C. (2021). All or nothing in sensory marketing: Must all or only some sensory attributes be congruent with a product’s primary function? Journal of Retailing, 97(3), 439–458. https://doi.org/10.1016/j. jretai.2020.09.006
Garfield, E., & Sher, I. H. (1993). Keywords plus [TM]-algorithmic derivative indexing. Journal-American Society for Information Science, 44, 298–298.
Greenacre, M., & Blasius, J. (Eds.). (2006). Multiple correspondence analysis and related methods. CRC Press.
Hawkins, D. M. (1977). Testing a sequence of observations for a shift in location. Journal of the American Statistical Association, 72(357), 180–186.
Holbrook, M. B., & Hirschman, E. C. (1982). The experiential aspects of consumption: Consumer fantasies, feelings, and fun. Journal of Consumer Research, 9(2), 132–140.
Huang, L.i., Chen, K.e., Zhou, M.i., 2020. Climate Change and Carbon Sink: A Bibliometric Analysis. Environ Sci Pollut Res, 27 (8), 8740–8758.
Hultén, B. (2015). Sensory marketing: Theoretical and empirical grounds. Routledge.
Ingale, K. K., & Paluri, R. A. (2020). Financial literacy and financial behaviour: A bibliometric analysis. Review of Behavioral Finance, 14(1), 130–154.
Kim, M., Kim, J.-H., Park, M., & Yoo, J. (2021). The roles of sensory perceptions and mental imagery in consumer decision-making. Journal of Retailing and Consumer Services, 61(5986), 102517.
Krishna, A. (2010). Sensory marketing: Research on the sensuality of products. Routledge.
Krishna, A. (2012). An integrative review of sensory marketing: Engaging the senses to affect perception, judgment and behavior. Journal of Consumer Psychology, 22(3), 332–351.
Krishna, A., Cian, L., & Aydinoglu, N. Z. (2017). Sensory aspects of package design. Journal of Retailing. 93(1), 43–54.
Krishna, A., Cian, L., & Sokolova, T. (2016). The power of sensory marketing in advertising. Current Opinion in Psychology, 10, 142–147.
Lawani, S. M. (1981). Bibliometrics: Its theoretical foundations, methods and applications. Libri, 31(Jahresband), 294–315.
Li, H., Wang, C. R., Meng, F., & Zhang, Z. (2019). Making restaurant reviews useful and/or enjoyable? The impacts of temporal, explanatory, and sensory cues. International Journal of Hospitality Management, 83, 257–265.
Low, M., & Siegel, D. (2019). A bibliometric analysis of employee-centered corporate social responsibility research in the 2000s. Social Responsibility Journal, 16(5), 691–717.
Merigo, J., Pedrycz, W., Weber, R., & de la Sotta, C. (2018). Fifty years of information sciences: A bibliometric overview. Information Sciences, 432, 245–268.
Nadanyiova, M., Kliestikova, J., & Kolencik, J. (2018). Sensory marketing from the perspective of a support tool for building brand value. Economics and Culture, 15(1), 96–104.
Olheten, E., Theoharakis, V., & Travlos, N. G. (2005). Faculty perceptions and readership patterns of finance journals: A global view. The Journal of Financial and Quantitative Analysis, 40(1), 223–239.
Petit, O., Velasco, C., & Spence, C. (2019). Digital sensory marketing: Integrating new technologies into multisensory online experience. Journal of Interactive Marketing, 45(1), 42–61.
Pine, B. J., & Gilmore, J. H. (1998). Welcome to the experience economy (Vol. 76, No. 4, pp. 97–105). Harvard Business Review Press.
Rani, A., & Salanke, P. (2023). A bibliometric analysis on business and management research during COVID-19 pandemic: Trends and prospects. IMIB Journal of Innovation and Management, 1 (2), 233–246.
Riehmann, P., Hanfler, M., & Froehlich, B. (2005). Interactive Sankey diagrams. In IEEE Symposium on Information Visualization, 2005. INFOVIS 2005. (pp. 233–240). IEEE.
Singh, S., & Dhir, S. (2019). Structured review using TCCM and bibliometric analysis of international cause-related marketing, social marketing, and innovation of the firm. International Review on Public and Nonprofit Marketing, 16(2–4), 335–347.
Velasco, C., Obrist, M., Petit, O., & Spence, C. (2018). Multisensory technology for flavor augmentation: A mini-review. Frontiers in Psychology, 9, 1–6.
Wörfel, P., Frentz, F., & Tautu, C. (2022). Marketing comes to its senses: A bibliometric review and integrated framework of sensory experience in marketing. European Journal of Marketing, 56(3), 704–737.
Zhang, X., Chen, H., Wang, W., & Ordóñez de Pablos, P. (2016). What is the role of IT in innovation? A bibliometric analysis of research development in IT innovation. Behaviour & Information Technology, 35(12), 1130–1143.