
1 Central University of Rajasthan, Ajmer, Rajasthan, India
2 H. N. B. Garhwal Central University, Pauri Garhwal, Uttarakhand, India
Creative Commons Non Commercial CC BY-NC: This article is distributed under the terms of the Creative Commons Attribution-NonCommercial 4.0 License (http://www.creativecommons.org/licenses/by-nc/4.0/) which permits non-Commercial use, reproduction and distribution of the work without further permission provided the original work is attributed.
This study aims to examine the impact of the COVID-19 pandemic on the e-commerce market in India. The pandemic had a detrimental effect on India’s economic growth, with trade and commerce being one of the worst affected segments of the economy. While the COVID-19-induced lockdown across the country severely affected significant retail chains and micro-retailers, it also created a boom in the e-commerce market. In this context, a survey was conducted across India to study the impact of COVID-19 on e-commerce in India using primary data. The results after data analysis clearly suggested that the post-pandemic period witnessed a significant rise in all spheres of the e-commerce market, and public familiarity with this concept also increased, which eventually resulted in an increase in both demand for and revenue from e-commerce.
COVID-19, e-commerce, consumer behaviour, revenue, retail chains
Introduction
Any crisis, in general, could have three possible ramifications. First, it could lead to innovations to cope with the crisis. Second, it could push societies to use the old ideas effectively that were already in existence but ignored earlier. The third possibility is that a crisis could, at times, act as a catalyst in the process of adapting to change that was underway even before the crisis unfolded. The world witnessed an unprecedented health emergency in the form of the COVID-19 pandemic, which claimed millions of lives. COVID-19 changed the way the world lives and conducts its daily business. Time spent at home increased as consumers suddenly found themselves confined to smaller spaces due to travel restrictions, and offices shifted from traditional settings to work-from-home environments. On the other hand, businesses had to quickly adapt their business processes as the preferences shifted from shopping in traditional offline outlets to online purchases (Amornkitvikai et al., 2021). They were also faced with the challenge of maintaining their competitive advantage over sales volumes, the number of active clients and the quality of services provided in the wake of disruptions in the long and complex supply chains.
It is to be noted that in this context the world witnessed all three ramifications. Businesses reinvented themselves in order to serve their customers in innovative ways. On the other hand, the already existing ideas that were largely underrated were put to use effectively, for instance, ‘work from home’ and ‘online teaching’. ‘E-Commerce’ too falls under the same category. Indeed, the existing concept of e-commerce started to be used far more effectively than before, and in fact, societies across the world adapted to the change faster, as COVID-19 acted as a catalyst.
According to a report released by Fidelity Information Services (FIS) (FIS Global, 2021), an international financial and technology organisation that studies payment trends in 41 countries, the global demand for digital commerce increased in 2020 during the coronavirus period, especially as consumers in many countries, including India, opted for new policies. According to FIS, the ‘Buy Now, Pay Later’ approach gained popularity in online payment methods. On the other hand, a survey of 3,700 consumers in nine emerging and developed economies by the United Nations Conference on Trade and Development (UNCTAD) on ‘COVID-19 and e-commerce’ reported that consumers in emerging economies made great strides in online shopping during the pandemic (United Nations Conference on Trade and Development [UNCTAD], 2021). According to the UNCTAD report, more than half of the survey’s respondents have frequently shopped online since the outbreak and relied heavily on the Internet for news, health information and digital entertainment. As such, many predictions underscore that the global e-commerce market grew the fastest during the COVID-19 pandemic. Even an OECD report found that COVID-19 resulted in a long-term shift from luxury goods to daily necessities through e-commerce. It also suggested how policymakers across the world can make use of the digital transformation in the retail segment in order to support business adoption (OECD, 2020).
In this context, the purpose of the present study is to further explore the impact of the COVID-19 pandemic on the e-commerce sector and to analyse in detail its development trends in India during the COVID and pre-COVID periods. E-commerce was in existence long before the pandemic struck India. However, the growth of the e-commerce market in India can be divided into two phases for a better understanding. The first phase is the one before the COVID-19 pandemic, and the second phase is the post-COVID-19 period. During the first phase, the growth of e-commerce was driven by several factors such as strong and sustainable growth of Internet users, the growing awareness of online shopping, increase in the online launch of products, low purchases and so on. Moreover, the growing number of unique products in the market and the reduction in commodity prices due to the direct distribution channel also further contributed to the growth of the e-commerce market in the country. However, after COVID-19 enveloped the country, e-commerce got a major push.
In this context, using the primary data, a survey was conducted nationwide to study the impact of COVID-19 on e-commerce in India. The researchers interviewed about 200 individual respondents as consumer group representatives from all over India using the questionnaire method of data collection, and Google Forms was used for ease of access and ease of circulation. The responses were collected during the period April–May 2021. The study period was divided into three parts to facilitate comparison and ease of pointing out contrast: (a) pre-COVID, (b) COVID wave 1 and (c) COVID wave 2.
The rest of the study is organised as follows. The second section deals with how e-commerce acted as a saviour in people’s daily lives during the COVID-19 pandemic. The third section discusses issues related to data collection, while the fourth section reports data interpretation and discusses results. Finally, the fifth section summarises the study and provides broad conclusions.
Literature Review: E-commerce as the Saviour During COVID-19
The COVID-19 pandemic caused millions of deaths across the world and posed an unprecedented challenge to public health, food systems and the world of work. The social structure and economy of the nation were in shambles due to the pandemic, with tens of millions of people at risk of reaching extreme poverty levels and malnutrition at an all-time high (Howton, 2020). Almost 3.3 billion people from the global working population were at risk of losing their livelihoods (British Broadcasting Corporation [BBC] News, 2020). Employees in the informal economy were especially vulnerable due to a lack of social protection and quality health care. Earning during the lockdowns became increasingly challenging, leading to a fall in purchasing power and consumption capability.
On the other hand, the complete lockdowns imposed by the governments worldwide to tackle the ongoing pandemic had a positive impact from a safety standpoint. Still, the economy tumbled into turmoil in most nations, especially India. According to the data published by the Ministry of Statistics and Programme Implementation (MOSPI, 2021), the growth rate in the manufacturing sector plunged to −9.4% in the fiscal year 2021 (Statista, 2021). As a direct response to the pandemic, the Indian automotive industry suffered a loss of ₹2,300 crore per day, and an estimated job loss in the sector was about ₹3.45 lakhs (The Economic Times, 2020). The service sector plummeted in terms of the gross value added per cent per annum to a growth rate of −8.36%, whilst the service sector was consistently contributing more than 50% of the nation’s GDP for more than 10 years (Dogga et al., 2023; Statistics Times, 2021). The retail market suffered severely in the service segment as business activities reached a standstill. People stopped visiting offline retail stores and markets due to curfews and lockdowns. As a result, the revenues of the offline stores and micro-retailers fell.
However, a positive development took place in this context, that is, the rise of e-commerce, which came as a saviour. Amidst the fear of economic contraction, the frequency of online purchases skyrocketed as it was the only safe and convenient option. COVID-19 catalysed this shift in consumer behaviour forced by pandemic-driven panic buying and stocking by the people (Sekar & Santhanam, 2022). People realised the convenience of online platforms, which triggered a significant shift in customers’ overall purchasing behaviour. Online stores such as Flipkart, Amazon and Snapdeal, which once served the purpose of purchasing non-essential commodities, offered self-care products, food and grains, and other essential commodities, which, in fact, top their respective retail lists of consumers. This is why it is the primary focus of this research.
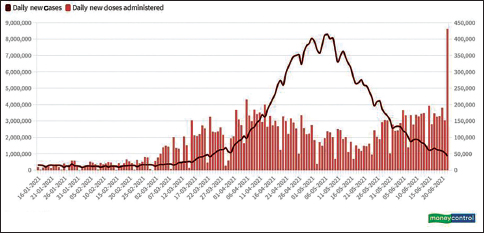
The objective is to study the impact of the COVID-19 pandemic on the e-commerce market with respect to data collected on online purchases, transactions and over-the-top streaming by the people. The pandemic-stricken atmosphere and the mass hysteria reportedly were a breeding ground for the rise of the e-commerce industry. A change in consumer behaviour was also fuelled by the pandemic. As shown in Figure 1, the country was nearing the end of the second wave of the virus, and by the time of the third wave, most of the population had received at least one dose of the vaccine, raising hopes that the third wave would not be as hard-hitting as the first and second. However, this is purely speculative as new variants/strains of the original SARS-CoV-2 virus have emerged, each more virulent than the last.
Due to excessive losses, most major retail chains and even micro-retailers reportedly transitioned to using e-commerce tools to reach customers. Major steps were taken by offline stores, such as the use of contactless payment systems, self-checkout systems and home delivery options, so as to gain at least a share of what was lost to the big e-commerce players.
Figure 1. COVID-19 Daily New Cases and Vaccine Doses Administered.
Source: MoHFW (2021).
Methods of Data Collection
In order to proceed with the objectives set up for this study, and given the nature of the research, it was clear that secondary data was going to be limited. Hence, it was decided that primary data would be collected from the citizens in an unbiased manner via the questionnaire method of data collection. The widely used Google Forms was used to make the questionnaire. The questionnaire used in the present study consists of both open-ended and closed-ended questions, and both of these were used to aid the current research. An open-ended question has no predefined responses and focuses on gathering the information from a respondent with no limitations, barring the word limit. A closed-ended question has predefined options for answers and will almost always have an element of choice (Worley, 2015).
The questionnaire titled ‘COVID-19 Impact on the E-commerce Sector’ consisted of five sections, as follows:
1. Basic information
2. Pre-COVID period analysis (October–December 2019)
3. COVID wave 1 period analysis (August–October 2020)
4. COVID wave 2 period analysis (February–April 2021)
5. Thoughts on the pandemic and e-commerce
Basic information: This section of the questionnaire consisted of questions aimed at attaining basic identity-related information about the respondent. Asking additional personal details such as names and contact information was avoided to ensure a sense of calm to the respondent whilst expressing their opinions freely. The study collected basic information such as the state of residence, gender, age group, education level and employment status, alongside essential details to fulfill the research goal. The respondents were asked to mention their level of familiarity and extent of usage of e-commerce shopping websites. In order to proceed with the analysis of COVID-19 in the e-commerce sector, it was deemed ideal to pick three uniform periods of three months, which represented the three stages of the spread of the virus in the nation.
The three periods were as follows: (a) pre-COVID: In late 2019, before COVID-19 had become a noticeable threat to the populace of the nation; (b) COVID wave 1: Three months were chosen from the end of 2020, wherein the national daily new COVID-19 positive cases peaked. Then, for a while at least, the number of cases started to reduce; and (c) COVID wave 2: Three months were chosen from the beginning of 2021, wherein the number of COVID-19 cases had reached an all-time high; it is referred to as the second wave of the pandemic with newer, more fatal strains of the virus. The study deliberately focused on these limited periods, as they capture the transition of e-commerce in India with the unfolding of an unprecedented health crisis. A separate study may also be undertaken by future researchers in this area about the developments in e-commerce in the post-COVID era. However, this study confines itself to the initial stages of the COVID-19 pandemic to get maximum insights into the developments during this period.
The data was collected for similar variables for these three time periods from every respondent through the questionnaire to facilitate a comparative study. The selection of variables representing changes in the e-commerce market was based on an OECD policy response analysis to the coronavirus and expert discussion in various online news media (OECD, 2020).
The following questions were asked: (a) the number of times the respondent physically went to a store during the study period; (2) the number of online purchases made during the study period; (c) the number of online money transfers and transactions done during the study period; (d) the amount of money spent on online purchases during the study period; (e) the amount of money sent through online money transfers and transactions during the study period; (f) number of hours spent per day consuming content on over-the-top streaming platforms during the study period; and (g) the type of commodity focused on whilst shopping online (essential/non-essential).
Thoughts on the pandemic and e-commerce: In this section, questions were asked to the respondents to understand their viewpoints or what they interpreted as the effects of the pandemic on both e-commerce platforms and retail stores concerning their purchasing patterns. Many times, what a respondent felt about the issue may not necessarily be what the data collected from them revealed about the same. Finally, the respondents were allowed to express what they felt were the effects of the pandemic on the e-commerce sector and retail chains as they saw fit with an open-ended question.
The questionnaire was distributed amongst Indian citizens of all ages throughout the country, and data was received from the same, even in the lockdown mode within which this research was conducted solely due to the assistance of online resources such as Google Forms, Google Meet and other online messaging platforms.
Data Analysis
The study used primary data collected from 192 respondents, representing almost every state of India, to get a broad perspective across the nation. The interpretation of the summarised data was made by considering each of the various variables taken into consideration with respect to both the first wave and the second wave of the pandemic and comparing them to the pre-COVID period considered for this study. It would be an interesting discussion to understand why certain variables changed as they did after the onslaught of the pandemic and to come up with meaningful policy implications. When evaluating the criteria for selection of appropriate periods depicting each wave of the pandemic, the period of three months was chosen as it was in September 2020 that the highest number of new cases were reported in India for the first wave of the pandemic (on 17 September 2020, 97,894 new cases were reported).
As the research was conducted in April 2021, February to April 2021 was taken as the period for the second wave, wherein the number of cases rapidly multiplied daily.
Some variables will be interpreted together as they represent the same end goal. The two variables considered were the number of online purchases made and the number of online money transactions and transfers made. According to the summarised data, both variables showed a sharp increase during the first wave of the pandemic, which was to be understood. As seen in Figure 2, the number of offline store visits declined sharply. Hence, people turned to alternative purchasing methods such as e-commerce shopping websites and corresponding e-commerce payment methods to purchase goods and services. Due to this, they recorded higher growth in revenue, too. Amazon’s and Flipkart’s incomes from operations increased by nearly 43% and 40% to ₹10,847.6 and ₹5,916.3 crore, respectively, by the end of April 2021 (Bureau, 2021). However, an interesting observation has been made: Although Amazon’s and Flipkart’s revenues increased, their losses also increased during the same period. This could be attributed to the increased transportation and storage costs and also compliance with the e-commerce laws set in place during the last months of 2018 by the DPIIT, which forced them out of using predatory pricing techniques which guaranteed profits in favour of retail stores and retail markets (Borkar, 2019).
Despite the higher costs incurred due to policy changes and the pandemic, there was increased revenue for e-commerce companies such as Amazon, Flipkart and others. This, in turn, increased the number of job opportunities in this segment and attracted foreign direct investment. Call centres were established in rural parts of the nation to facilitate online support for consumers, creating job opportunities and revenue for the rural population. Amazon decided to invest $630 million in its partners and subsidiaries in 2020 and is said to invest even more ($26 billions) by 2030 owing to the unscathed market scope in the nation (Pradeep, 2019; Reuters, 2023). This, in turn, also led to increased tax revenue for the government due to the excess revenue for the e-commerce platforms, and hence, the contribution of e-commerce platforms to the GDP also increased. Indian e-commerce market grew 40% in 2020, grossing $38 billion gross merchandise value (GMV), up from $27 billion in 2019 (Chengappa, 2020). In the long run, the increased revenues could possibly lead to increased expenditure on research and development in the companies and hence to more consumer satisfaction and job opportunities. In addition to this, the fallout of increased usage of e-commerce and higher use of online payment methods such as net banking and UPI increased the amount of revenue earned by private and public banks. This is because, for each UPI money transfer above ₹1,000, most banks charge the user ₹5, and for each net banking money transfer, the banks charge ₹2 plus goods and services tax (GST) (Paisa Bazaar, 2021). The increase in revenue led to an increase in liquid funds in the banks to some extent and, hence, an increase in the loanable funds, which were very much needed for the slowing economy.
Figure 2. Approximate Number of Online Purchases Made by People in the Three Periods.
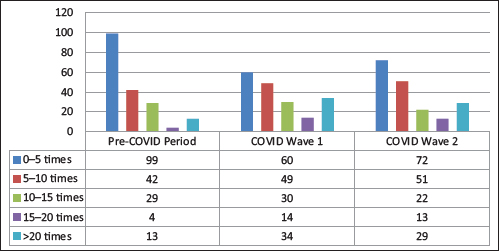
Figure 3. Approximate Number of Online Transactions Made by Men and Women in the Three Periods.
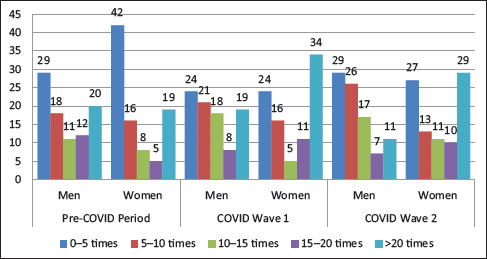
As shown in Figure 3, the first wave of the COVID-19 pandemic saw a surge in online purchases and money transfers through e-commerce platforms, with a subsequent reduction during the second wave. Despite this decline, the levels remained significantly higher than the pre-COVID period. Retail store owners, adapting to the changed circumstances, innovated by implementing home delivery services after facing losses in the first wave. This shift attracted customers who preferred quicker local deliveries over traditional e-commerce platforms, diminishing their dominance during the second wave.
The pandemic’s impact on online purchasing and money transfers is compared across genders. Post-pandemic, more men visited retail stores, while women surpassed men in online purchases and money transfers. A CNBC survey revealed women preferred e-commerce, while men favoured brick-and-mortar stores (Thomas, 2018). Pre-COVID, India used e-commerce mainly for non-essential items. Post-pandemic, despite a shift to online shopping for essentials, men tended to stick to offline stores, while women continued purchasing non-essentials online.
Figure 4. Approximate Amount of Money Spent by People on Online Purchases in the Three Periods.
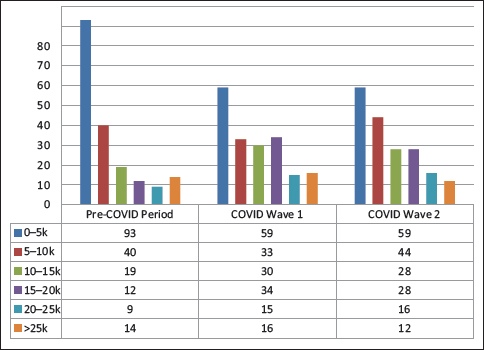
The second and third variables taken into consideration can also be clubbed together. The researchers will not go into the depths of interpreting the summaries of these variables, as they imply the same conclusion as the above two variables. They are the amount of money spent on online shopping and the amount of money transferred via e-commerce payment platforms.
Figure 4 illustrates that the average Indian citizen spent more on online purchases via e-commerce websites during the first wave of the pandemic compared to the pre-COVID period. While the number of online purchases slightly declined, spending during the second wave decreased but remained higher than pre-pandemic levels. This trend is consistent with the amount of money transferred online, which significantly increased during the first wave but reduced the gap during the second wave.
These developments, in turn, resulted in an increase in the speed and efficiency of deliveries, which led to a relative rise in the demand for goods from retail sources. This could be the possible reason behind the decline in the amount of money transferred and spent online for commodities. However, one could not conclude that people went back to relying on offline stores again, as the amount of money spent on online shopping was still far higher than that of the pre-COVID period. People have gotten and are now used to using online shopping and online payment methods and the convenience associated with them, and this will not be lost anytime soon. Even online food delivery applications such as Swiggy and Zomato saw huge revenue increases due to the adoption of this new delivery service. In FY20, Swiggy had a total revenue of ₹2,776 crores, whilst in FY19, its total revenue was ₹1,292 crores. This means that there was a 115% increase in revenue (Abrar, 2021).
Similarly, Zomato’s total revenue for FY20 was sapped at ₹2,486 crores, whilst their revenue stood at ₹1,255 crores in FY19 (Peermohamed, 2021). Hence, Zomato saw an increase in revenue of 98%. This massive jump in revenue was due to people’s dependence on food and home delivery applications supported by e-commerce in order to obtain even the most essential of commodities, such as food.
From an economic standpoint, the changes in the variables in question offer interesting insights. As people started using e-commerce platforms extensively, a part of their income was devoted to the same. As the prices of goods are generally lower online compared to retail stores, people purchasing online are left with more savings than earlier. This unexpected increase in savings leads to a further increase in aggregate demand for goods, which is, in fact, essential for economic recovery.
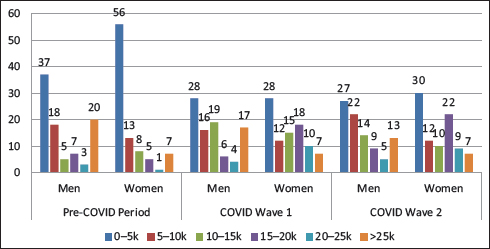
This study also made an attempt to understand online purchasing trends from a gender perspective. In the pre-COVID period, the amount of money spent by men on online transfers and transactions using e-commerce payment services was far higher than that spent on the same vis-a-vis women. After the first wave of the pandemic struck, a sharp increase in the amount of money spent by women on e-commerce payment platforms like UPI was witnessed; it even slightly surpassed that by men. Surprisingly, this trend continued even during the second wave of the pandemic, which is depicted in Figure 5.
The time spent on OTT platforms is another key variable considered by the present study. OTT platforms or over-the-top streaming platforms witnessed a considerable rise in India even before the pandemic struck due to the increased awareness and the realisation by the public about the comfort of watching favourite films and soap operas at home, besides avoiding travel costs, ticket charges and exorbitant theatre food prices. But after the pandemic struck, OTT platforms such as Netflix, Amazon Prime Video, Sony LIV and Voot saw an unprecedented acceleration in their growth.
Figure 5. Approximate Amount of Money Transferred Online by Men and Women in the Three Periods.
When the data on the number of hours spent daily on OTT platforms was summarised, it can be observed from Figure 6 that Indians spent little to no time on OTT platforms in the pre-COVID period, even though more than half the population was familiar with the same. But when the pandemic struck, the time spent by users daily increased very significantly, with most citizens preferring to watch anywhere between 1 and 4 hours of content a day. This trend continued on to the second wave as the number of people who watched 4–6 hours of OTT content a day increased sharply to match the number of people who watched for 2–4 hours.
When the data was divided based on gender to identify the difference in the impact of the pandemic on OTT services for each gender, the following inferences were obtained from the summarised data. In the pre-COVID period, as seen in Figure 7, the usage of OTT services was very low; even though people were familiar with the content, they were unwilling to pay as they did not find it necessary. In this period, men and women used OTT services to the same extent. When the first wave of the pandemic struck, the overall time spent on OTT services skyrocketed, but women seemed to have led the charge (refer to Figure 8). The number of women who watched more than 2–6 hours of content a day vastly outweighed the number of men who did the same. The same trend continued in the second wave as women consumed way more OTT content than men (refer to Figure 9). A possible reason could be explained using the other variables’ inferences. As seen in Figure 5, men chose to visit offline stores throughout the pandemic, and women preferred to resort to e-commerce shopping websites for their purchases and preferred the transfer of money online compared to men who still chose offline methods. This insinuates that women were more connected to digital media and technology than men during the pandemic, and this may have led them to being more open to the concept of substituting offline media sources with online OTT platforms for all media consumption needs.
Figure 6. Average Number of Hours Spent per Day on OTT Platforms.
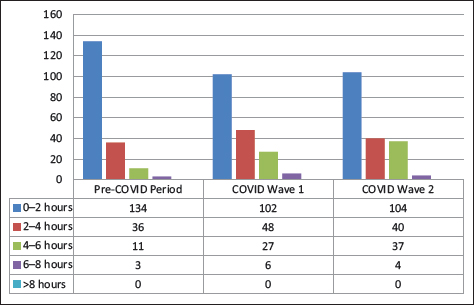
Figure 7. Average Number of Hours Spent per Day by Men and Women on OTT Platforms in the Pre-COVID Period.
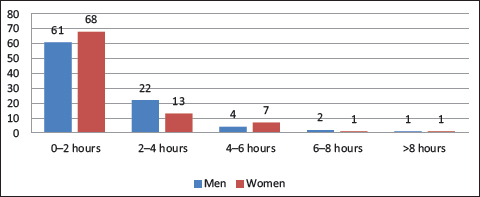
Figure 8. Average Number of Hours Spent per Day by Men and Women on OTT Platforms in the COVID Wave 1 Period.
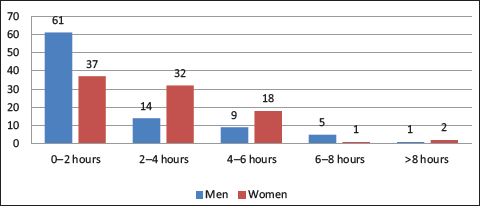
Figure 9. Average Number of Hours Spent per Day by Men and Women on OTT Platforms in the COVID Wave 2 Period.
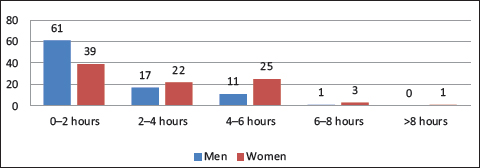
Figure 10. Impact of COVID-19 Pandemic on the E-commerce Market.
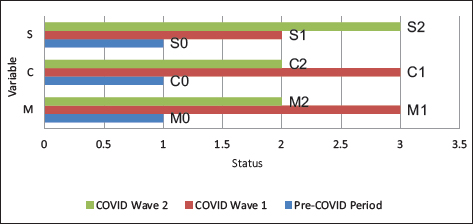
Figure 11. Difference in the Impact of COVID-19 Pandemic on the E-commerce Market for Men and Women.
Another possible reason may be that OTT platforms accept payment only through e-commerce money transfer services. Women prefer to use them over physical transfers anyway; women may have purchased the subscription and consumed more content on OTT whilst the men of the house may not have bought and hence watched alongside the women for less amount of time.
All in all, it is a fact that the OTT video streaming market in India was booming and had reached a growth rate of 28.6% CAGR (BrandMedia, 2021) during the first wave and seemed to have increased even further, leading to more investment by OTT companies in India, resulting in a rise in job opportunities and hence increase in the nation’s per capita income.
Let the variables be denoted as follows: (a) income spent on and number of online purchases (M), (b) income spent on and number of online cash transactions (C), and (c) average number of hours per day or time spent on OTT streaming services (S). The time period of the research was divided into three parts to facilitate comparison and ease of pointing out the contrast: (a) pre-COVID period (0), (b) COVID wave 1 period (1), and (c) COVID wave 2 period (2).
It was found that the penetration of e-commerce platforms before the pandemic struck was quite low compared to the pandemic period, so the values of the online purchase variable (M0), online transaction variable (C0) and OTT streaming variable (S0) are kept as ‘low = 1’. This is the base point.
As illustrated in Figure 10, when the first wave of the pandemic hit, there was a rise in online purchases (M1 = ‘Highest = 3’), online cash transactions (C1 = ‘Highest = 3’) and the amount of time spent consuming content on over-the-top streaming platforms (S1 = ‘Higher = 2’). When the second wave hit, there was a decrease in online purchases (M2 = ‘Higher = 2’) and online cash transactions (C2 = ‘Higher = 2’). It was still way higher than in the pre-COVID period, but the e-commerce services that used the B2C, C2B and C2C models saw a slight decline in both demand and revenue. Conversely, peoples’ familiarity with OTT streaming platforms such as Netflix and Amazon Prime Video increased, and hence, the time spent on OTT platforms (S2 = ‘Highest = 3’) was even higher than at the time of the first wave.
Table 1. Summary of the Data from the Three Variables in the Three Time Periods.

Note: M: Income spent on and number of online purchases; C: Income spent on and number of online cash transactions; S: Average number of hours per day or time spent on over-the-top streaming services.
Table 2. Each Variable’s Status Linked to a Ranked Numerical Value for Graphical Representation.

Note: This table shows the numerical values/ranks that were assigned to each status of the three variables in each time period considered for the research to ease the process of graphical depiction. As assigned, when a variable’s status is low in a time period, its numerical value/rank is 1 and hence is the lowest as compared to higher or highest.
Table 3. Each Variable’s Status Linked to a Ranked Numerical Value for Each Gender Separately for Graphical Representation.

Note: This table shows the numerical values or ranks that were assigned to each status of the three variables separately for men and women in each time period considered for the research to ease the process of graphical depiction. As assigned, when a variable’s status is low in a time period, its numerical value/rank is 0.2 and hence is the lowest as compared to middle or high.
Table 4. Summary of the Data from the Three Variables Separately for Each Gender in the Three Time Periods.

Note: M: Income spent on and number of online purchases; C: Income spent on and number of online cash transactions; S: Average number of hours per day or time spent on over-the-top streaming services.
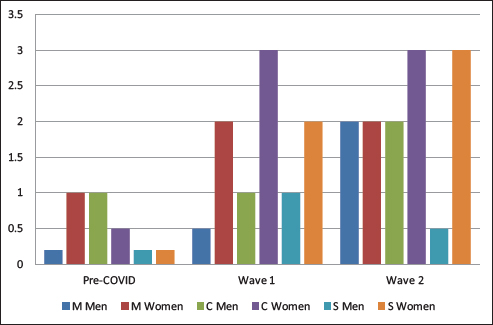
It was found that the penetration of e-commerce platforms before the pandemic struck was quite low compared to the pandemic period in both sexes, online purchases (M) for women and online transactions (C) for men (refer to Figure 11). From the graph, it is visible that women seem to have spearheaded the mass adoption of e-commerce platforms during the first wave, as compared to men, who used them more in the pre-COVID period. When the second wave hit, women were still ahead of men when it came to the adoption of e-commerce platforms, but the difference between them decreased.
From Tables 1–4, it is clear that the e-commerce platforms penetrated deeper into Indian society during the COVID-19 period, when compared to the period before the pandemic stuck. This does not appear to be a short-term phenomenon. It is a fact that the usage of e-commerce platforms could possibly reduce in the post-pandemic era. However, it may not get back to the pre-pandemic levels, given the ease, comfort and sense of empowerment it brings along with it. Thus, it is time policymakers and the business class recognise this digital transformation that Indian society is going through. While the policymakers need to focus on reducing the complexities and policy uncertainties related to e-commerce, they also need to encourage innovations in this segment in the time to come. On the other hand, businesses need to adapt to this change and design sales strategies, keeping the growing synergies between online and offline transactions in a billion-plus populated Indian market.
Conclusions
This study investigated the impact of the COVID-19 pandemic on the e-commerce market, focusing on consumer behaviour with respect to gender. The analysis includes online shopping sites (B2C model), online payment platforms (B2C and C2B models) and OTT streaming platforms (D2C model). A descriptive study utilising a graphical-tabular analysis reveals a significant surge in e-commerce services during the first pandemic wave, with all three types experiencing exponential growth. While the second wave saw a slight reduction in online shopping and payment platform usage, it still exceeded pre-pandemic levels. Conversely, OTT streaming platforms continued to grow during the second wave. Gender-specific analysis indicates that women predominantly drove the initial shift towards e-commerce during the first wave, but men caught up during the second wave. Overall, the pandemic acted as a catalyst for the growth of the e-commerce market in India, and the resulting changes in consumer behaviour are likely to endure.
Managerial Implications
In this context it is pertinent to understand that this paradigm shift may not be reversed easily in the time to come, even after the pandemic ends. This change in the buying behaviour of the consumer and their preferences provides key insights for the marketers, and it is time for them to go back to the drawing table and re-design their old strategies of targeting the customers. Earlier, the brands used to drive the consumption, but now it has been reversed, with the consumers making or breaking the brands, thanks to the Internet and the sea of information available on the social media sites about almost every product or service that is being offered. This consumer empowerment would have a serious impact on the way the goods and services are bought and sold in the time to come. On the other hand, it is pertinent for the policymakers to understand and acknowledge this change and design policies in such a way that they facilitate the growth of e-ecommerce, while protecting the interests of the retailers, which is, indeed, a tough balancing task.
Acknowledgement
The authors are grateful to the anonymous referees of the journal for their extremely useful suggestions to improve the quality of the article.
Declaration of Conflicting Interests
The authors declared no potential conflicts of interest with respect to the research, authorship and/or publication of this article.
Funding
The authors received no financial support for the research, authorship and/or publication of this article.
ORCID iD
Satyanarayana Murthy Dogga  https://orcid.org/0000-0001-5892-3981
Abrar, P. (2021, January 28). Swiggy’ s revenue jumps 115% to Rs 2,776 cr, losses up 61% to Rs 3,768 cr. Business Standard. https://www.business-standard.com/article/companies/swiggy-s-revenue-jumps-115-to-rs-2-776-cr-losses-up-61-to-rs-3-768-cr-121012800027_1.html
Amornkitvikai, Y., Tham, S. Y., & Tangpoolcharoen, J. (2021). Barriers and factors affecting e-commerce utilization of Thai small and medium-sized enterprises in food and beverage and retail services. Global Business Review, 1(24), 1–24. https://doi.10.1177/09721509211036294
BBC News. (2020). Coronavirus: Four out of five people’s jobs hit by the pandemic. https://www.bbc.com/news/business-52199888
Borkar, S. (2019). Modi’s new e-commerce policy 2018 (impact on online retail giants Amazon/Flipkart, end consumers and benefits to the local retail sector). https://www.mondaq.com/india/consumer-law/775328/modi39s-new-e-commerce-policy-2018-impact-on-online-retail-giants-amazon-flipkart-end-consumers-and-benefits-to-the-local-retail-sector
BrandMedia. (2021). The rise of OTT platforms in India during the pandemic. https://www.mid-day.com/lifestyle/infotainment/article/the-rise-of-ott-platforms-in-india-during-the-pandemic-23180042
Bureau, F. (2021, January 13). Snapdeal Amazon, Flipkart report increase in losses, while operating revenues grow for some. The Financial Express. https://www.financialexpress.com/industry/snapdeal-net-losses-increase-by-43/2169691/
Chengappa, S. (2020, September 18). Pandemic tailwinds: E-commerce sales set to double in 2020. The Hindu. https://www.thehindubusinessline.com/info-tech/pandemic-tailwinds-push-e-commerce-growth-estimate-to-40-in-2020/article32620816.ece
Dogga, S. M., Kuruva, M. B., & Kahsyap, M. (2023). What have been driving India’s economic growth? An empirical analysis. The Indian Journal of Economics, 1–16. https://doi.org/10.1177/0019466223121
FIS Global. (2021). The global payments report 2021. https://worldpay.globalpaymentsreport.com/en/?strala_id=1002907&utm_campaign=Global+Payments+Report+2020&utm_medium=Web+Referral&utm_source=Business+Wire
Howton, E. (2020). COVID-19 to add as many as 150 million extreme poor by 2021. https://www.worldbank.org/en/news/press-release/2020/10/07/covid-19-to-add-as-many-as-150-million-extreme-poor-by-2021
Ministry of Statistics and Programme Implementation. (2021). 2021–22 Annual report of Ministry of Statistics and Programme Implementation. https://pib.gov.in/PressReleaseIframePage.aspx?PRID=1942795
OECD. (2020, October 7). E-commerce in the time of COVID 19. https://www.oecd.org/coronavirus/policy-responses/e-commerce-in-the-time-of-covid-19-3a2b78e8/
Paisa Bazaar. (2021). UPI charges. https://www.paisabazaar.com/banking/upi-charges/
Peermohamed, P. A. (2021, January 4). Zomato’ s revenue nearly doubles, loss widens 160% in 2019-20. The Economic Times. https://economictimes.indiatimes.com/tech/startups/zomatos-revenue-nearly-doubles-loss-widens-160-in-201920/articleshow/80099897.cms?from=mdr
Pradeep, P. (2019). Amazon to invest USD 630 million into its Indian subsidiaries. https://kr-asia.com/amazon-to-invest-usd-630-million-into-its-indian-subsidiaries
Reuters (2023, June 24). Amazon raises investment in India to $26 billion by 2023. https://www.reuters.com/world/india/amazon-commits-15-billion-india-investment-ceo-says-2023-06-24/#:~:text=NEW%20DELHI%2C%20June%2023%20(Reuters,Modi%20in%20the%20United%20States.
Sekar, S., & Santhanam, N. (2022). Effect of COVID-19: Understanding customer’s evaluation on hotel and airline sector: A text mining approach. Global Business Review, 1(19), 1–19. https://doi.10.1177/09721509221106836
Statista. (2021). Growth rate of GVA in manufacturing across India from financial year 2015 to 2021. https://www.statista.com/statistics/801821/india-annual-real-gva-growth-in-manufacturing-industry/
Statistics Times. (2021). Sector-wise GDP growth of India. https://statisticstimes.com/economy/country/india-gdp-growth-sectorwise.php
The Economic Times. (2020, December 15). Lockdown impact: Automotive industry suffered Rs 2,300 crore loss per day, says par panel. https://economictimes.indiatimes.com/industry/auto/auto-news/lockdownimpact-automotive-industry-suffered-rs-2300-crore-loss-per-day-says-parpanel/articleshow/79742229.cms?from=mdr#:–:text=New%20Delhi%3A%20In%20the%20wake,M%20Venkaiah%20Naidu%20on%20Tuesday
Thomas, L. (2018, March 18). Men aren’t willing to shop online as much as women, survey finds. CNBC. https://www.cnbc.com/2018/03/19/men-arent-willing-to-shop-online-as-much-as-women-survey-finds.html
United Nations Conference on Trade and Development. (2021). COVID-19 and e-commerce. https://unctad.org/system/files/official-document/dtlstictinf2020d1_en.pdf
Worley, P. (2015). Open thinking, closed questioning: Two kinds of open and closed question. Journal of Philosophy in Schools, 2(2), 19–29. https://doi.10.21913/jps.v2i2.1269