
IMIB Journal of Innovation and Management

 Search

1 University Department of Management, Vinoba Bhave University, Hazaribagh, Jharkhand, India

This article is distributed under the terms of the Creative Commons Attribution-NonCommercial 4.0 License (http://www. creativecommons.org/licenses/by-nc/4.0/) which permits non-Commercial use, reproduction and distribution of the work without further permission provided the original work is attributed.
The goal of this research is to look at how the Indian stock market sectoral indices respond to three macroeconomic variables: oil price (OP), gold price (GP) and exchange rate (ER) between 2016 and 2020. The data of sectoral indices were collected from the Bombay Stock Exchange. The underlying series is evaluated as non-stationary at the level, but stationary in the first difference, using the augmented Dickey–Fuller unit root test. The multivariate co-integration analysis and vector error correction model indicates that there are long-term links between macroeconomic variables and sectoral indices in the information technology sector. Meanwhile, the research using the vector auto regression model approach shows that there are short-run correlations between macroeconomic variables and sectoral indices, namely Basic Materials, Fast Moving Consumer Goods, Finance, Healthcare, Information Technology, Auto, Bankex, Power and Reality. The results document that OP, GP and ER simultaneously have a significant effect on sectoral indices in the Indian stock market. To stabilise the stock market post-COVID-19, the authorities are advised to put economic policies sector-wise to accelerate the economic growth and to maintain fiscal discipline. The authorities need to stabilise the aforementioned macroeconomic variables to accelerate the economic growth as the ER has a significant negative impact on all sectors.
BSE sectoral indices, vector error correction model, vector auto regression model, macroeconomic variables
Introduction
In December 2019, the novel coronavirus (2019-nCoV) or COVID-19, an infectious disease, first appeared in Wuhan, Hubei Province, China. In January 2020, it drew worldwide attention due to its quick proliferation compared to other coronavirus strains. The Chinese government’s response to the current virus was to place the city of Wuhan, which was the epicentre of COVID-19, under complete lockdown, which eventually proved to be an effective step in controlling the pandemic in many countries across the world. In an effort to avoid the spread of the disease, the whole city was locked down on 23 January 2020. The first death case of the COVID-19 pandemic was reported by the Chinese authorities along with WHO on 11 January 2020; its features were similar to pneumonia of unknown origin that caused maximum damage to developed countries such as America, Spain, Russia, UK, Italy, France and Germany, affecting 215 countries and territories around the world and 2 international conveyances. The first case in India was reported on 15 February 2020, and thereafter until 13 January 2021, the number of cases had reached to 10,502,332 with 99% recovery rate. This aggravated the socio-economic conditions of the country.
The global stock markets have been impacted by the economic losses caused by COVID-19. The pandemic’s contagion effect on global stock markets is noticeable in practically every continent, with the Indian stock market also being one of the exchanges that was affected by COVID-19. Earlier also, the stock market crashed several times due to different reasons such as the cryptocurrency crash in 2018, European sovereign debt crisis in 2010 and financial crisis of 2007–2008. These crises always affect the volatility of the market. Since uncertainty increases market risk, it is critical to understand the stock market volatility in order to calculate the cost of capital and evaluate investment and leverage decisions. The stock market has thus become a significant instrument in capital development and economic progress. Several research on the links between macroeconomic variables and the stock market have been undertaken in India and other countries (Gan et al., 2006; Hosseini et al., 2011; Maysami et al., 2004; Mukherjee & Naka, 1995; Ouma & Muriu, 2014; Patra & Poshakwale, 2006). The previous studies clearly indicate that the changing macroeconomic variables have significant effect on developing markets like India. Tripathi et al. (2014) in their study of the effects of macroeconomic variables on sectoral indices in India found a high correlation among the variables and concluded that only foreign institutional investment (FII) affects all sectoral indices, while the rest of the macroeconomic variables selectively affect different sectoral indices in India. The stock market had a lot of volatility during the COVID-19 period that made a low of 7,610 on 23rd March and an all-time high of 14,564 within a year on 13 January 2021. The graph of NIFTY clearly indicates the variation which has taken within a year during the COVID-19 period (see Figure 1). The objective of this research is to determine the linkages of the Indian stock market with different macroeconomic variables (gold price [GP], oil price [OP] and exchange rate [ER]).
Figure 1. Historical Chart of NIFTY 50 for Last Two Years.
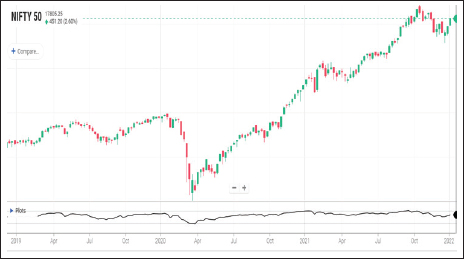
Source: https://charts.5paisa.com/
Literature Review
Linkages Between Gold Price and Stock Market Movement
Historically, gold has always trended higher in countries experiencing stock market slumps since it is largely viewed as a safe investment, and wise investors prefer to move their cash to the safer side. A negative link between gold prices and stock prices is expected based on historical evidence. The increase in demand of gold during recession is not only due to the domestic demand but the central bank also played a pertinent role in it. There is innumerable usage of gold such as investment, jewellery and risk diversifier, which make it very precious, and even the central government uses gold as collateral when they experience trouble with their balance of payments and need to borrow currencies from the international capital markets. Gold is also a safe investment when the rupee weakens, when conditions of high global inflation arises or during political disasters. It helps to diversify the portfolio, and it can be used as a hedging tool at the time of crises (Gaur & Bansal, 2010; Kaliyamoorthy & Parithi, 2012; Sumner et al., 2010). Gold is used as an investment asset class by investors (Jain & Biswal, 2016). Spot gold can be used as a hedge against stock market volatility (Dey & Sampath, 2018).
Linkages Between Oil Price and Stock Market Movement
Oil can be considered as a lifeline of any country as various industries, transports, ports, etc., run through it. OPs can sometimes transmit return and volatility to stock markets in oil-exporting countries in a two-way fashion. From OPs to the stock market, there are poor unidirectional return and volatility transmissions. While the link between OPs and stocks grew during the crisis, it dramatically decreased afterwards (Bouri, 2015). According to Constantinos et al. (2010), there is a significant positive causal effect running from the OP index returns and OP volatility towards the stock market returns. In most nations, the relationship between the OP shock distributions and stock market returns is not steady over time. Positive and negative OP shocks have an asymmetric effect in the US market as observed by Sim and Zhou (2015). They are less evident in most nations for both the baseline and extended periods (Tchatoka et al., 2019). There are several studies in relation to OPs and stock market movements whose results are mixed. Some studies show bidirectional linkages, some studies show positive and negative unidirectional linkages, and some studies show no linkages between the undertaken two variables.
Linkages Between Exchange Rate and Stock Market Movement
There is a wealth of literature on the relationship between the ER and the stock market movement. Various types of connections have been discovered in various research. There are bidirectional volatility spillovers between the two markets, implying that future volatility in the stock market has a significant impact on future volatility in the foreign currency market and vice versa (Zhao, 2010). In terms of ER regimes, trade volumes, capital regulation and the size of the equity market, the linkages differ between economies (Pan et al., 2007). The return on the stock market had a causal effect on the return on the ER, with the possibility of a minor effect in the opposite way (Nath & Samanta, 2003). The stock market general index and the ER have a causal link. In this case, causality goes from the stock market general index to the ER. The ER is causally linked to the services sector index, implying that the ER precedes the services sector index. In this circumstance, the exchange rate can be utilized as a policy tool to stabilize the exchange rate in order to attract foreign portfolio investments for the services sector index and the overall general sector index (Farooq, et al., 2004).
As a result, the purpose of this study is to provide more information about the links between the movement of BSE sectoral indices and macroeconomic factors such as crude oil price (CP), GP and ER. The research will be helpful to individuals and institutional investors as it will provide alternatives for the diversification of portfolios which can raise returns of their portfolios by minimising their risks.
Research Gap and Motivation
In India, the financial literacy rate is poor. People have less knowledge about investment, and they are more fascinated towards banking and insurance products for earning returns on their capital as they are more concerned about safety of the principal amount. Stock market investment is still not a preferred investment alternative among Indians, especially in the eastern region. However, as we all know, the stock market reflects the economy, and it is responsible for capital formation and economic progress. The Indian stock market cannot be seen in isolation rather all the markets that include American, Chinese, European or Japanese are interrelated, and spillover effect is common in each market. Their movement also gets affected by various other macroeconomic variables. The effect of various macroeconomic variables is different on different sectors, so not only the indices but the various sectors and their included companies are also getting affected due to the changes in the macroeconomic variables. The previous linkages may have distorted due to COVID-19 that need to be checked through empirical studies. It would have certainly impacted the Indian stock market and their respective sectors also. The stock market, as we all know, fluctuates from day to day and is influenced by a variety of factors, including changes in macroeconomic variables such as CP, GP and ER. As a result, understanding the dynamic movement of sectoral indices in connection to changes in macroeconomic variables is critical for investors. Previous studies are more in relation to market indices with macroeconomic variables, and limited studies were done in relation to sectoral indices and changes in macroeconomic variables. As a result of the scarcity of information about the movement of sectoral indices, this study focuses on the long-term and short-term relationships between the selected macroeconomic variables (CP, GP and ER) and 10 sectoral indices of Bombay Stock Exchanges (BSEs), namely Basic Materials, Energy, Fast Moving Consumer Goods (FMCG), Finance, Healthcare, Information Technology, Auto, Bankex, Power and Reality. The results of the study will guide the investors towards the construction of well-diversified portfolio in stock market.
Research Design
Data
In this research, the data related to stock market was taken from BSE. The sectoral indices data includes sectors such as Basic Materials, Energy, FMCG, Finance, Healthcare, Information Technology, Auto, Bankex, Power and Reality. The three different macroeconomic variables selected for this research are GPs, whose data was taken from mcxindia.com, CPs, whose data was also collected from mcxindia.com, and ER, whose data was collected from x-rates.com, on a daily basis from 2016 to 2020.
Methodology
The present study employed unit root test, co-integration test, vector error correction model (VECM) and vector auto regression (VAR) model to find results. Descriptive statistics were used to explain the nature of data. The stationarity of underlying series was evaluated by using the augmented Dickey–Fuller (ADF) unit root test. Johansen co-integration test and VECM were used to check the long-term connections between macroeconomic variables and sectoral indices, whereas the VAR model was used to evaluate short-run linkages between macroeconomic variables and sectoral indices, namely Basic Materials, FMCGs, Finance, Healthcare, Information Technology, Auto, Bankex, Power and Reality.
The variables employed in the study are briefly described in Table 1.
Results
Descriptive Statistics
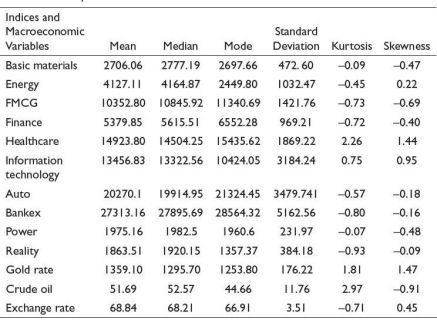
Table 2 summarises the descriptive statistics of sectoral indices and macroeconomic variables taken from different websites. It presents the results of mean, median, mode, standard deviation, skewness and kurtosis of closing prices of the undertaken series for a period of five years from 2016 to 2020. The data of standard deviation indicates that the volatility is higher in Auto, IT, and Banking sector, whereas Power sector is the least volatile. Closing prices of some sectors are positively skewed, whereas some of the sectors are negatively skewed. The kurtosis value is highest for healthcare index, and crude oil is closer to mesokurtic.
Table 1. Variables Description.
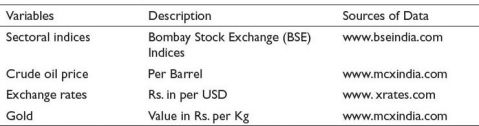
Table 2. Descriptive Statistics of All Indices and Macroeconomic Variables.
Source: www.bseindia.com
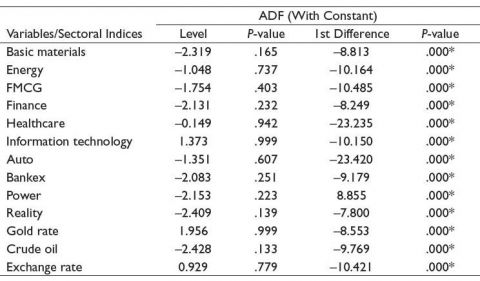
Table 3. Unit Root Test Results.
Abbreviations: CE, cointegrating factors; Lmax, this Lmax tests the null of r cointegrating vectors against the alternative of r+1 cointegrating vectors; r, number of relationships.
Note: * Denotes significance at 1% level.
Unit Root Test
It is critical to address the issue of data stability early in the process, as it will have an impact on the results that will be provided at the conclusion of the study. A unit root test was performed to fix this issue. The unit root test is performed using the ADF test, which can validate whether or not the data has a unit root. Table 3 shows the results of the stationarity test using the ADF test.
All the 12 series were run through ADF with constants based on level, and the results revealed that they are non-stationary. The series were then transformed to 1st difference and all the 12 series were examined using ADF with constants, with the findings indicating that the series are stationary. The series were found to be stationary at a 1% significant level at the first level difference. The data series are now stable, allowing for additional analysis.
Johansen Cointegration Test
The connections of the sectoral indices with macroeconomic variables were examined at I (1). The long-term and short-term relationships between the variables were investigated. During the study period, the Johannsen cointegration test was used to check the long-run linkages between the variables. The results of Johannsen cointegration test for different sectoral indices have been presented in Table 4.
According to the analysis of cointegration Table 4, it was found that there exist long-run linkages only in the information technology (IT) sector for the period under study at 5% level of significance. The p-value was checked at 5% level of significance. The results are the same for both trace tests and maximum eigenvalue, indicating significant long-term links between the data series. The assumed hypothesis are as follows:
NH1: Long-run linkages do not exist between macroeconomic variables and sectoral indices.
AH1: Long-run linkages exist between macroeconomic variables and sectoral indices.
Based on the findings, the null hypothesis is accepted for all sectoral indices except the IT sector. As a result, there is a long-run relationship between macroeconomic variables and the IT sector only. During the study period, the other sectors had no long-run relationships with macroeconomic factors. At a 5% level of significance, the p-value for the IT sector index implies at most one cointegrating association.
Table 4. Johannsen Cointegration Test Result.
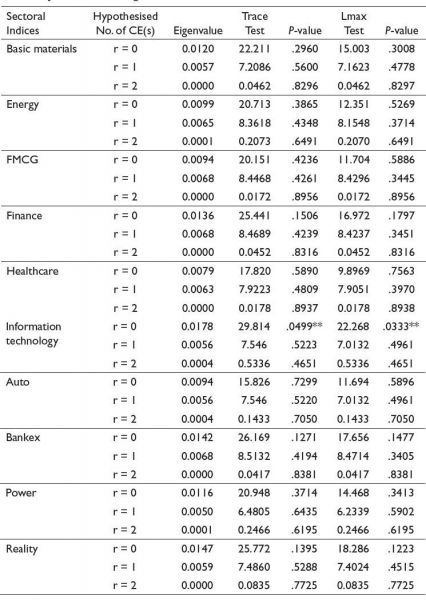
Note: ** Denotes significance at 5% level.
VECM Causality Test
VECM causality test was conducted for all the sectoral indices, and significant information was concluded for various sectors. The short-run linkages were found between sectoral indices and macroeconomic variables. Table 5 summarises the findings of the VECM test. The table indicates that short-run linkages exist between sectoral indices such as Basic Materials, FMCG, Healthcare and Information Technology with crude oil. The short-run linkage was present in between Information Technology and Gold only and no short-run linkages were present in between any sectoral indices with ERs. Both the vector error correction method and cointegration results suggested that the IT sector index and macroeconomic variables have both long- as well as short-run linkages.
VAR Causality Test
Short-run links between the sectoral indices and macroeconomic variables were examined using vector autoregression (VAR) model that is not cointegrated in the long run. Table 6 represents the short-run linkages at 5% level of significance. Only the Auto sector has a short-run causality with gold. Crude oil has short-run causality towards Basic Materials, Finance, Bankex and Power sector indices at 5% and 1% levels of significance. The reality sector is significantly having THE short-run linkage with ER.
Table 5. VECM Causality Test Result.
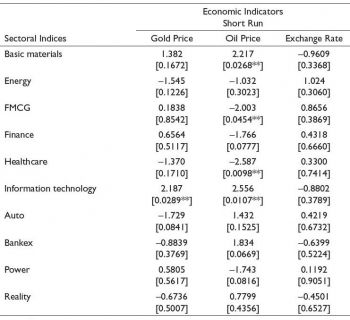
Note: ** Denotes significance at 5% level.
Discussion and Conclusion
Based on the time series data, this research evaluated the short- and long-run linkages between sectoral indices and selected macroeconomic factors. The findings of the data analysis revealed that there are both short- and long-run linkages between the BSE indices and macroeconomic indicators. According to the findings, there is a long-term relationship between the Information Technology industry and selected macroeconomic factors, while it was concluded that some of the sectors such as Basic Materials, FMCG, Healthcare, Finance, Bankex, Power and Information Technology have short-run linkages with crude oil. The Auto and Information Technology sectors have short-run causality with GPs, whereas ER has a short-run causality with the Reality sector. The study is useful for investors and fund managers who can utilise the results of this research to make a well-diversified portfolio. The results will provide insight about the movement of various sectors with macroeconomic variables. The findings show that the OP, GP and ER have a considerable impact on sectoral indices in the Indian stock market. To stabilise the stock market post-COVID-19, the authorities are advised to put the economic policies sector-wise to accelerate the economic growth and to maintain fiscal discipline. To boost the economic growth, the authorities must stabilise the aforementioned macroeconomic variables, as the ER has a substantial negative influence on all the sectors.
Table 6. VAR Causality Test Result.
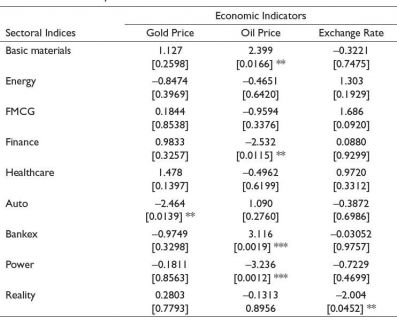
Note: ** Denotes significance at 5% level; *** denotes significance at 1% level.
The research is limited to three macroeconomic variables and the Bombay stock market sectoral indices. Further research can be done on a broad spectrum by utilising a greater number of macroeconomic variables and indices of different countries to make a general consensus on the results. The time span was also limited to five years that can be increased to make the results more robust.
Declaration of Conflicting Interests
The author declared no potential conflicts of interest with respect to the research, authorship and/or publication of this article.
Funding
The author received no financial support for the research, authorship and/or publication of this article.
Bouri, E. (2015). Oil volatility shocks and the stock markets of oil-importing MENA economies: A tale from the financial crisis. Energy Economics, 51, 590–598.
Constantinos, K., Ektor, L. A., & Dimitrios, M. (2010). Oil price and stock market linkages in a small and oil dependent economy: The case of Greece. Journal of Applied Business Research (JABR), 26(4). https://doi.org/10.19030/jabr.v26i4.306
Dey, S., & Sampath, A. (2018). Dynamic linkages between gold and equity prices: Evidence from Indian financial services and information technology companies. Finance Research Letters, 25, 41–46.
Farooq, M. T., Keung, W. W., & Kazmi, A. A. (2004). Linkage between stock market prices and exchange rate: A causality analysis for Pakistan [with comments]. The Pakistan Development Review, 43(4), 639–649.
Gan, C., Lee, M., Yong, H. H. A., & Zhang, J. (2006). Macroeconomic variables and stock market interactions: New Zealand evidence. Investment Management and Financial Innovations, 3(4), 89–101.
Gaur, A., & Bansal, M. (2010). A comparative study of gold price movements in Indian and global markets. Indian Journal of Finance, 4(2), 32–37.
Hosseini, S. M., Ahmad, Z., & Lai, Y. W. (2011). The role of macroeconomic variables on stock market index in China and India. International Journal of Economics and Finance, 3(6), 233–243.
Jain, A., & Biswal, P. C. (2016). Dynamic linkages among oil price, gold price, exchange rate, and stock market in India. Resources Policy, 49, 179–185.
Kaliyamoorthy, S., & Parithi, S. (2012). Relationship of gold market and stock market: An analysis. International Journal of Business and Management Tomorrow, 2(6), 1–6.
Maysami, R. C., Howe, L. C., & Hamzah, M. A. (2004). Relationship between macroeconomic variables and stock market indices: Cointegration evidence from stock exchange of Singapore’s All-S sector indices. Jurnal Pengurusan, 24(1), 47–77.
Mukherjee, T. K., & Naka, A. (1995). Dynamic relations between macroeconomic variables and the Japanese stock market: an application of a vector error correction model. Journal of Financial Research, 18(2), 223–237.
Nath, G. C., & Samanta, G. P. (2003). Relationship between exchange rate and stock prices in India: An empirical analysis. https://www.semanticscholar.org/paper/Relationship-between-Exchange-Rate-and-Stock-Prices-Nath-Samanta/6625a99b4ac5a4c4090c35d3a62d866603ac7c42
Ouma, W. N., & Muriu, P. (2014). The impact of macroeconomic variables on stock market returns in Kenya. International Journal of Business and Commerce, 3(11), 1–31.
Pan, M. S., Fok, R. C. W., & Liu, Y. A. (2007). Dynamic linkages between exchange rates and stock prices: Evidence from East Asian markets. International Review of Economics & Finance, 16(4), 503–520.
Patra, T., & Poshakwale, S. (2006). Economic variables and stock market returns: Evidence from the Athens stock exchange. Applied Financial Economics, 16(13), 993–1005.
Sim, N., & Zhou, H. (2015). Oil prices, US stock return, and the dependence between their quantiles. Journal of Banking & Finance, 55, 1–8.
Sumner, S., Johnson, R., & Soenen, L. (2010). Spillover effects among gold, stocks, and bonds. Journal of Centrum Cathedra, 3(2), 106–120.
Tchatoka, F. D., Masson, V., & Parry, S. (2019). Linkages between oil price shocks and stock returns revisited. Energy Economics, 82, 42–61.
Tripathi, V., & Seth, R. (2014). Stock market performance and macroeconomic factors: The study of Indian equity market. Global Business Review, 15(2), 291–316.
Zhao, H. (2010). Dynamic relationship between exchange rate and stock price: Evidence from China. Research in International Business and Finance, 24(2), 103–112.
